Making my map of campus was a bit of a learning curve, but it was really interesting to explore the works of ArcGIS, a platform you can use to design data-driven maps. I used data from this .CSV spreadsheet, which contained information about my five favorite locations on campus.
Uploading the data was fairly easy, and so was choosing a basemap (I chose light gray). Most of the roadblocks I ran into came with further customizing the map. For instance, I had trouble figuring out how to change the symbology to reflect a trend or a pattern; eventually, I found out that I needed to click the “Types (unique symbols)” tab rather than “Location (single symbols).” This helped me change the color of each marker to reflect what kind of building it was—you can find what each color means in my map’s legend. I also changed the transparency to show how many days a week I visit that location, with higher transparency denoting fewer days. I also added labels with this information, so it’s easy to see right on the map.
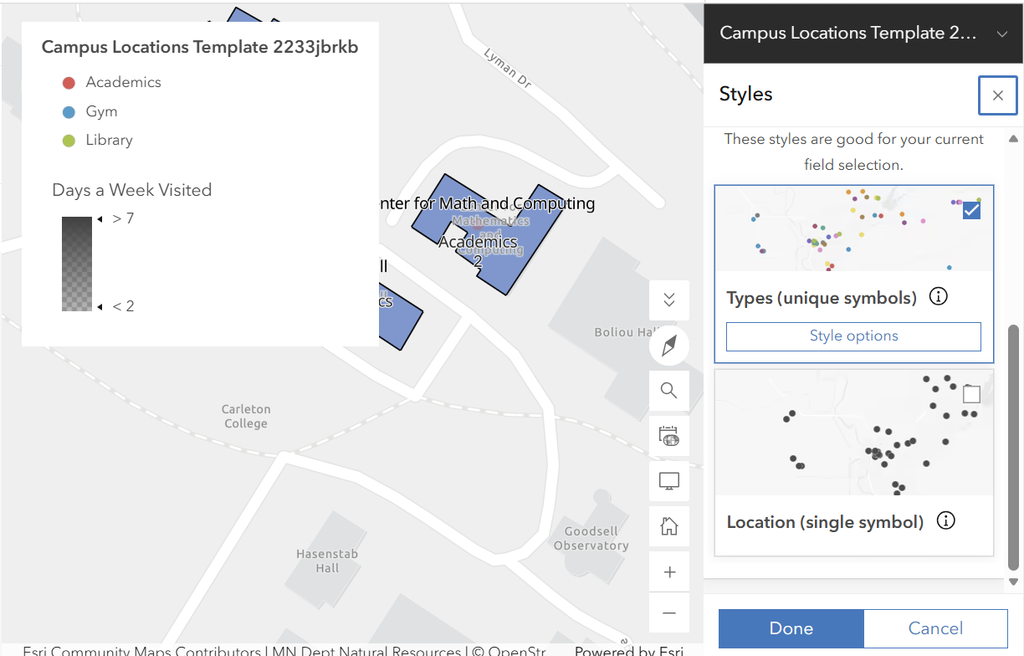
I then created my polygon feature layer, drew out the layout of each building, and configured my instant web app!
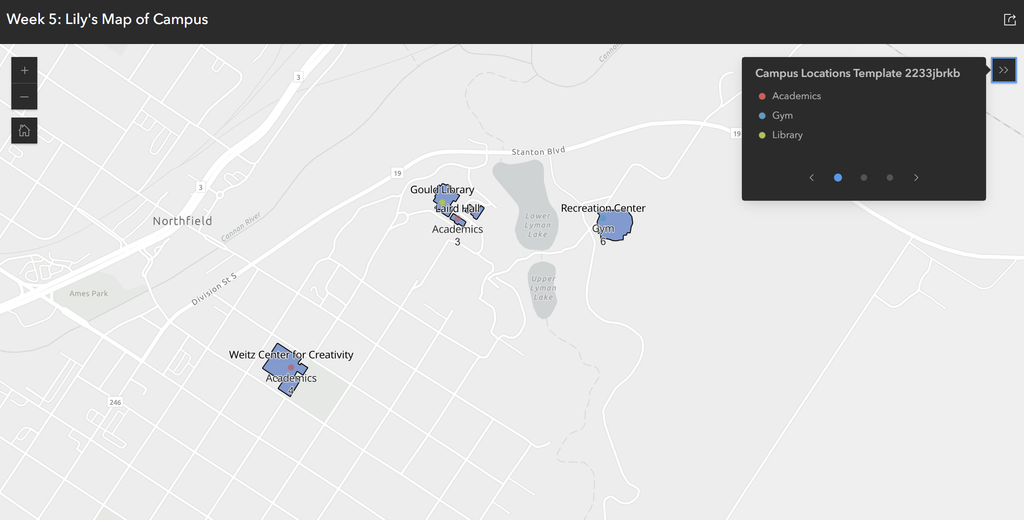
Overall, I found ArcGIS to be fairly straightforward to work with as a beginner. It has plenty of options for customization, labeling, and symbology that would work well for other DH projects, and uploading data was a super convenient, quick process. Furthermore, after looking over my finished app, I think this kind of web mapping opens up many possibilities for DH projects. Not only is it a great way to showcase data spatially, but it’s very easy to share web map projects publicly so everyone can have access to them. This creates new potential for education in fields such as history or human geography, where spatial data might be involved.
I liked the way you used transparency to show how often you visited each place throughout the week. I thought it was a cool method of to show more information on your map. Because the ArcGIS customization options confused me, it was helpful to see how you used them to display different details.