In the big 2026, being able to click a few buttons to generate really complicated sets of data has become a normal ability of science and digital humanities. Today, methods that stand out are usually those who make those clicks as painless and as useful as possible. Today, tool designers should be asking what the user really wants to be able to do and how to let them perform the actions in the most efficient way.
Annotating Maps is an excellent example of when tool designers answer this question correctly.
I, the user in question, wanted to label the places at or near Carleton that I have used to lock in on homework.
After making a list of all of the places, I referenced the browsers map tool, and plugged all of the cordinates into a csv (link)
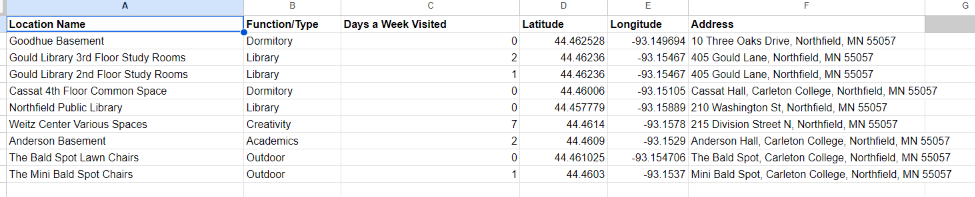
After that, I just plugged it into the ArcGIS software, and my job was already mostly done.
In previous posts, I have mentioned that I sometimes will want to customize data in odd ways that typical default settings don’t support. For this map, I wanted to color code the points based on the Building’s location type. Admittedly, this was not a super specific task, but I was still pleased to find how gracefully the software handeled this request.
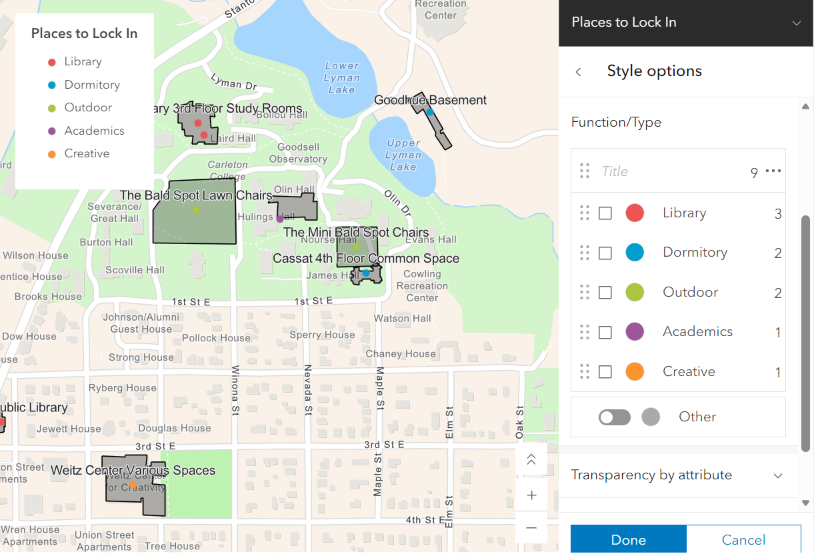
If I wanted, I could make fine-grained adjustments to the color, label type, and field type without having to break from the coherent UI that was presented. I personally believe that the designers excelled in letting the user decide how advanced they were willing to advance the map. Rarely did I feel like I was stumbling onto a feature above my current comprehension without willingly choosing to navigate to those settings, conversely, I felt like they didn’t hide the more advanced features too far within submenus.
Below is my final result. It’s a simple map, but it does what it is supposed to do, that is, it successfully marks the nine places I have mentally decided are good locations for locking in.
In general, I can clearly see that mapping is a critical tool to DH. Multi-media storytelling is one of the key reasons for DH’s existence, and maps are one of the core methods for visual narration. Mapping reveals patterns that a list of text would otherwise obscure; by taking advantage of 2-dimensional analysis, what would have been a very complicated relationship can be arranged to be accessible for everyone to see clearly.