the process of learning and creating
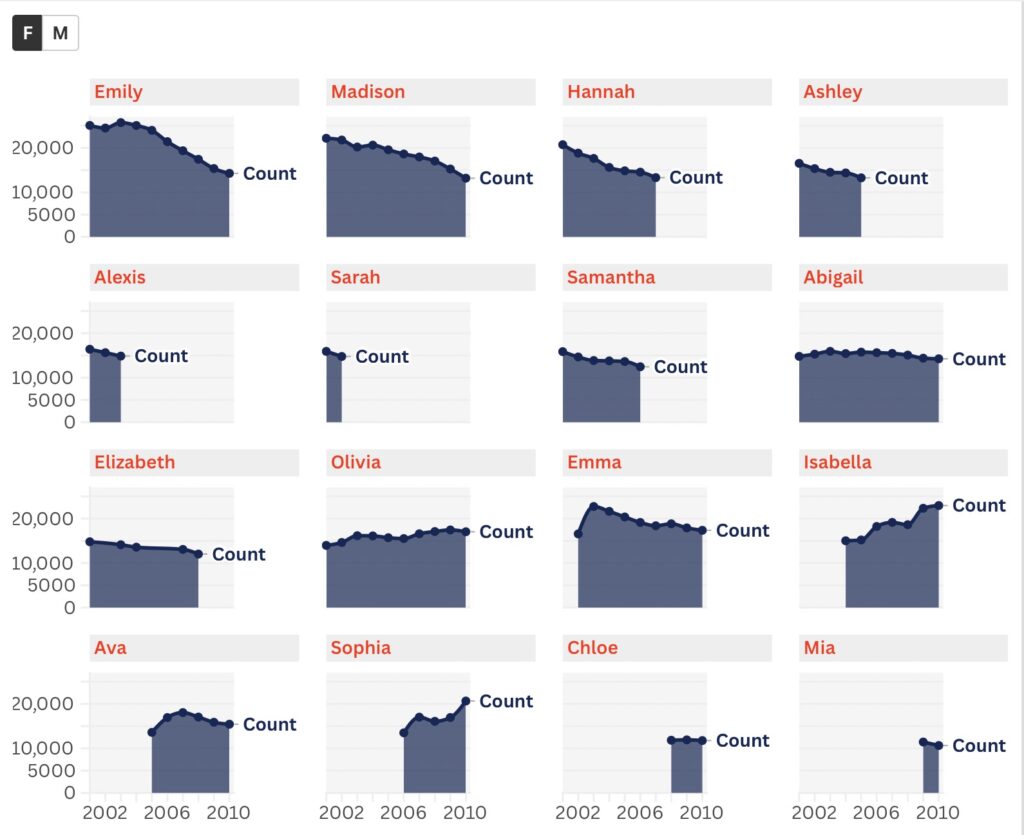
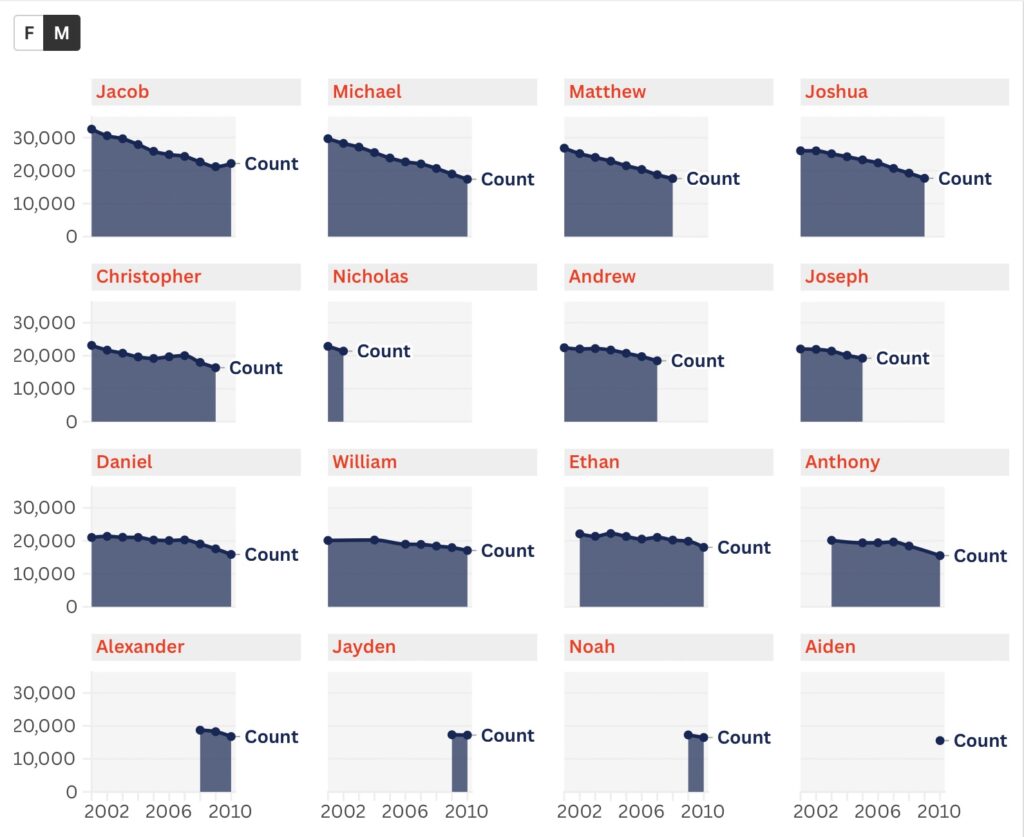
The tool I used for this project is Flourish, and this was my very first time visualizing a dataset. As I looked at the dataset, the information that stood out most to me was the ranking of baby names and their gender. I wanted to create a graph that showed how the popularity of baby names changed over the years while keeping male and female names separate. When I inserted the dataset into one of the templates provided by the website, I found that the website did not interpret the data very well. The format was off, and it was difficult to understand the purpose of the graph. Therefore, I tried several different options. First, I experimented with bar charts and pie charts, but I found them misleading. Eventually, I discovered that stacked area charts gave me the result I had envisioned. For the visualization and overall style, I created two separate groups of charts, one for male names and one for female names, so readers could choose which set to examine. I also decided not to visualize the “ranking” of baby names because I thought the counts themselves could tell the story more clearly. To make the graphs easier to interpret, I adjusted the size of the labels and added more striking colors so that readers could see the patterns more clearly.
Reflection
In terms of reflection, I would like to introduce the reading “Introduction: A History of Visualization and Power” by L. Klein in Data by Design: An Interactive History of Data Visualization, 1789–1900. Klein argues that visualization is powerful because it can make complicated patterns easier to recognize, but this power can also hide the choices made by the person who creates the graph. A visualization may appear to simply present data “as it is,” even though its final form is shaped by decisions about what information to include, how to organize it, and what visual form to use. My experience with Flourish made this argument much easier to understand. The same baby-name dataset looked completely different when I presented it as bar charts, pie charts, and stacked area charts. The data itself did not change, but the story communicated by the visualization did. This also made me think more carefully about my own role as the designer.