Chosen graph style and how it’s appropriate
For my graph, I chose to represent male names and their rankings. I originally struggled deciding how to visualize a large amount of data. I was choosing between several different graph types. However, I eventually found that a heat map was the most simple and effective way to show the difference in rankings. This is because one can easily refer to the color key and see how high or low the ranking is. It’s a clear and straightforward way of symbolizing the data.
Changes made to improve clarity
I changed a few elements of the default style to make my graph clearer. I started by changing the colors. I chose colors that were high in contrast to make the difference in ranks more obvious. The second element I changed was expanding the size of the legend at the top left of the graph. When I originally created the graph, the legend was squished. I expanded it so it would be easier for the audience to decipher.
Image of my graph
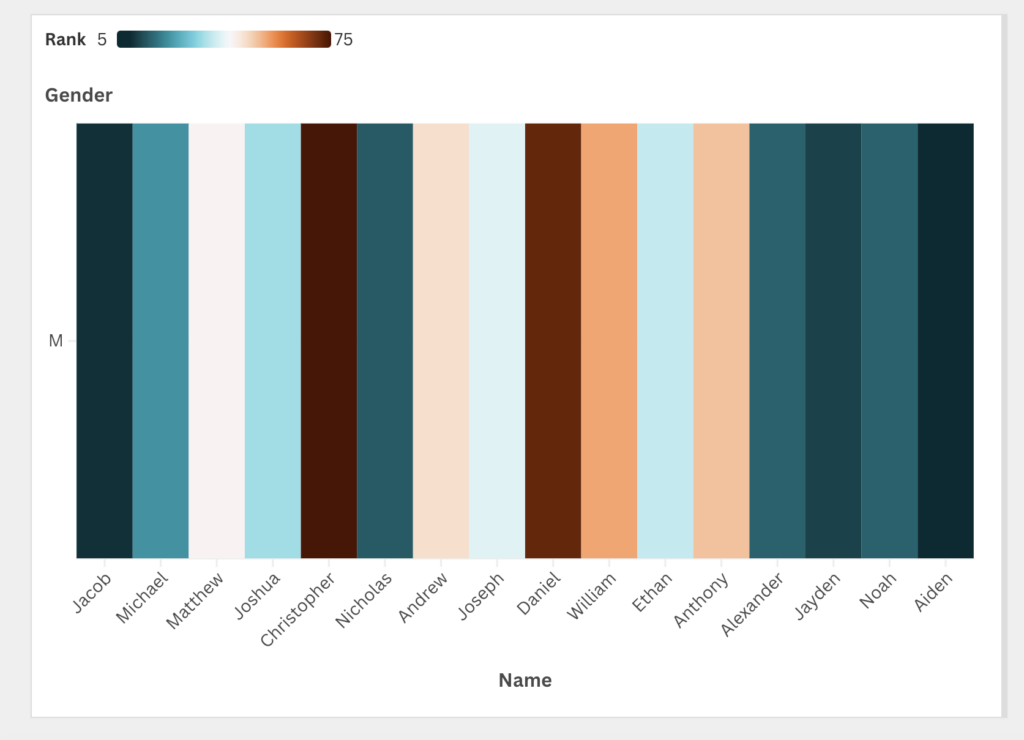
Reflections from lin’s lecture
In Lin’s lecture, she talks about several different design principles to consider when creating a graph. The main one that I employed in my graph is contrast which I discussed above. Another design principle I focused on for my graph was simplicity. I tried to make my graph simple so it would be easy to look at and comprehend. In her lecture, she also talks about how graphs can show us different patterns and relationships amongst data. I found this to be a really helpful framework to think about when deciding what I wanted to include in my graph. Overall, I felt that Lin’s lecture helped facilitate the process of making this graph.
Relation to digital humanities
My visualization relates to digital humanities because it was made using an efficient digital tool, Flourish. This program and others like it are often used by digital humanists during the project creation phase.