For my Week 2 blog post, I decided to focus on The Rhythm of Food, a project done in partnership with Google News Lab and Truth & Beauty. After viewing this video made by Miriam Posner that explains the elements of Digital Humanities projects, I applied the framework that she provided to get a better insight into what goes on behind the scenes of this project. This project aims to study food culture through the lens of Google searches. The creators gathered weekly data on Google Trends for hundreds of food-related topics for over fifteen years and explored seasonality, holiday-related patterns, and cultural shifts in food searches.
The structure of this project can be divided into three main parts – sources, processes, and presentation. Sources include the data from Google Trends, but also FooDB was used as a base for food terminology, as well as Google Knowledge Graph topics for distinguishing different interpretations of the same term (for example, the fruit “apple” vs Apple computers). In this project, the data is taken only for the USA.
The process is what makes this project particularly interesting. At first, the creators experimented with traditional line charts but then came up with a radial “year clock”. Each segment is one week, with the distance to the center being a measure of relative search interest and color representing the year. This helps the user to observe the seasonal patterns, but also pay attention to the fluctuations in interests in certain foods.
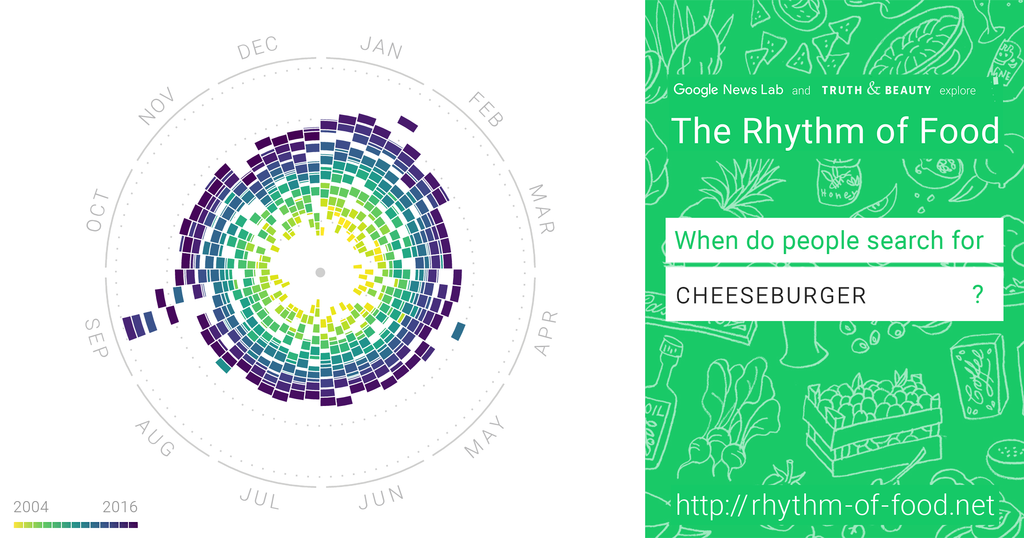
Cheeseburger Chart
Example of the site’s presentation with the radial”Year Clock”, Week Segments, and Coloring for the Year
The presentation of this project includes an interactive website with radial charts, animations, annotations, and other tools for exploring various foods. As it is targeted at a wide audience rather than scholars only, this project is related to the fields of digital humanities, data visualization, food studies, and sociology, since it uses digital data in order to study human culture.
One of the questions I had during the reverse engineering of this project was the following: how accurately can Google searches represent food culture? People searching for a food item do not necessarily like or eat it. The project demonstrates in this way how digital humanities can make our daily internet behavior data into social evidence.
Hi Jake, you bring up great points. I also looked into the Rhythm of Food website, so I appreciated reading about another perspective on the same site. Considering your question, I do think there are lots of limitations when trying to apply Google Trend data to real life trends. Of course, there’s overlap that can be seen, but so much of the world (especially as it relates to food) does not exist online. Part of the website that really pointed that out to me was that sometimes they highlighted trends related to food trends (i.e. turkey being more popular during November), but it also reflected cultural moments, such as Ariana Grande licking those donuts like 10 years ago. This points to how much data can be interpreted in many different ways, and as such, the numbers don’t really mean anything without the human interepretation. It points to the importance of digital humanities generally, to adapt the data in ways that people can understand in proper contexts, bringing value to numbers which might otherwise be meaningless.