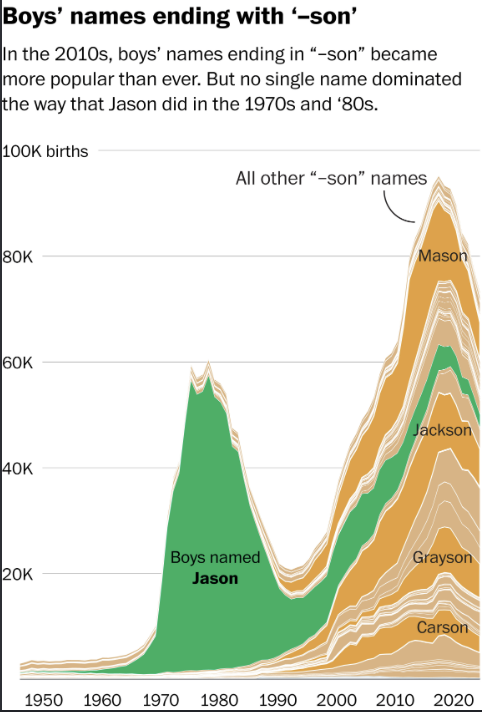
For this post, I decided to explore a specific linguistic pattern in baby naming trends: the massive rise of boys’ names ending in “-son” across several decades. Rather than looking at top names individually, I wanted to see how a shared phonetic suffix reflects broader cultural shifts over time. To capture this phenomenon, I used a stacked area graph, which allows us to view both the total aggregate volume of births for this naming category and the individual contributions of specific names within the overall trend.
A stacked area chart is particularly effective here because it highlights the structural difference between two distinct eras. In the 1970s and 1980s, the popularity of the “-son” suffix was overwhelmingly driven by a single dominant name: Jason. By contrast, when the suffix surged again in the 2010s, the popularity was fragmented across a wide variety of names like Mason, Jackson, Grayson, and Carson. The graph shows that even though “-son” names became more popular than ever recently, parents picked many different names instead of all choosing the same one.
To improve the visual clarity and narrative impact of the graphic, I made two targeted design modifications:
Selective Color Highlighting: Instead of assigning random default colors to dozens of overlapping layers, I used a bold emerald green specifically for Jason and Jackson to highlight their central roles in the two respective peaks, while rendering all other “-son” names in cohesive shades of gold and beige.
Direct Path Typography: I positioned key name labels directly on top of their corresponding area streams and added an annotated leader line pointing to the collective mass of smaller names. This reduces visual distraction by keeping the reader’s eyes focused directly on the data paths rather than constantly checking a separate key.
This exercise directly links to Lin Winton’s insights on how data visualization functions within Digital Humanities. Visualizations are not neutral containers for raw data; they are designed arguments that frame how we interpret historical cultural shifts. By curating colors and labels intentionally, the chart moves beyond a simple list of numbers to tell a compelling story about how American naming conventions shifted from single-name conformity to stylistic variation.