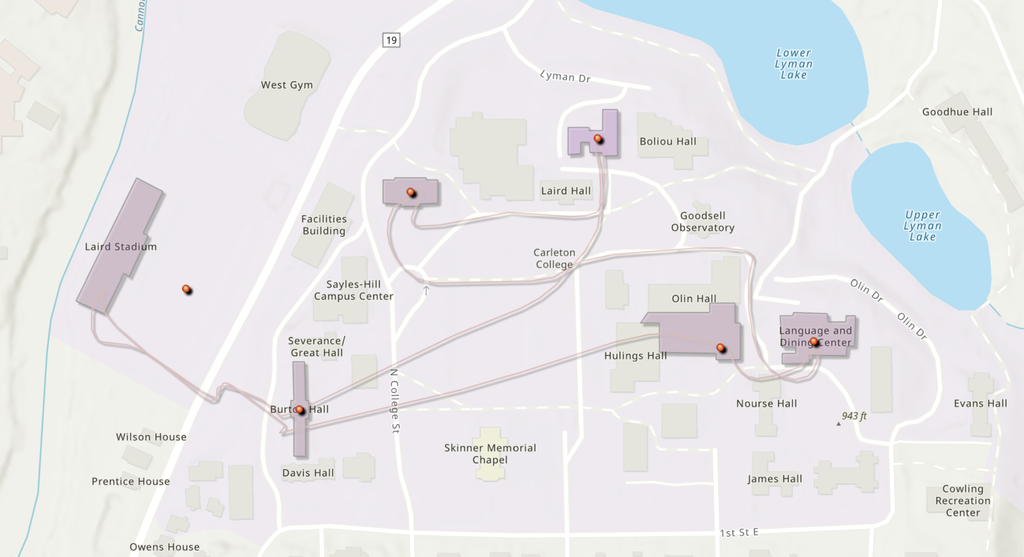
For this lab, I created an ArcGIS Online map using data from a CSV spreadsheet and mapped Six campus locations. The project involved uploading point data, selecting an appropriate basemap, customizing symbology and labels, creating building footprint polygons, and publishing the final product as an Instant Web App.
Spreadsheet- https://docs.google.com/spreadsheets/d/109n9X2xVSK-VG3xMGVTHNk6WzrHJc3aOL5CwrblWPSU/edit?usp=sharing
ArcGIS Map
Process and Design Decisions
When designing my map, I selected a basemap that provided enough detail to clearly show campus buildings while still allowing my own data layers to remain visible. After importing my CSV file, I adjusted the symbology to better highlight patterns within the data rather than relying on ArcGIS’s default settings. I also added labels to make locations easier to identify and drew polygon features outlining the buildings represented in the dataset. These additions helped provide context and made the map easier to interpret.
One of the most challenging parts of the project was learning how to navigate the ArcGIS Online interface. While the platform provides a large number of tools and customization options, finding specific settings was sometimes difficult because many features are hidden within menus and submenus. Tasks that seemed simple, such as changing layer properties or modifying symbology, often required several steps before I located the correct controls.
Reflection on ArcGIS Online
Although the user interface was sometimes frustrating to work with, ArcGIS Online offers powerful customization capabilities. Being able to edit symbols, labels, popups, and polygon features makes it possible to create maps that communicate information much more effectively than a default map. These tools would be especially useful for projects such as mapping historical landmarks, visualizing demographic changes over time, documenting archaeological sites, plotting environmental data, or creating interactive campus resource maps. The ability to combine geographic information with additional descriptive content allows users to tell stories through maps rather than simply displaying locations.
Potential for Digital Humanities
This lab demonstrated how web mapping can be a valuable tool for Digital Humanities (DH) work. Digital humanities projects often focus on the relationship between people, places, and historical events. Interactive maps allow researchers to visualize those relationships in ways that traditional text cannot. For example, scholars could map migration patterns, historical events, literary settings, cultural landmarks, or changes in communities over time. Because maps are interactive, users can explore information independently and discover patterns that may not be immediately obvious in written sources.
Without doubt, I concur with you regarding the frustrations that come along with the use of ArcGIS in that it takes time to find certain features within the software. I appreciated the fact that you went ahead to plot building outlines in addition to the places and customized the map as well. What intrigued me is your idea of using interactive maps to analyze migration trends and historical events.