This graph shows the analysis of the dataset, which includes statistics from the Social Security Administration’s baby names dataset and demonstrates how the popularity of babies’ names in the USA has changed during the period between 2001 and 2010. This topic caught my attention because although everyone hears different names every day, changes in the popularity of those names are not observed often enough.
I first started by making the graph and uploading the dataset. Next I selected the names to be shown by being placed on the line rather to the side of the line. After that I sorted each name by gender, male names being blue and female names being pink, which makes it easier to distinguish between the lines of different genders.
I determined that it would be appropriate to use a line chart for the representation of this data since the main point of interest here is the change in the popularity of certain names within the period of ten years. Each name will have its line showing the popularity, and the years will be marked on the x axis, while the number of babies with specific names will be on the y axis. One will be able to compare the lines of names and see how popular each of them has become with time. This graph is connected with Digital Humanities directly as it uses statistics that will help find some patterns in culture. However, the visualization will not show the cause of these tendencies.
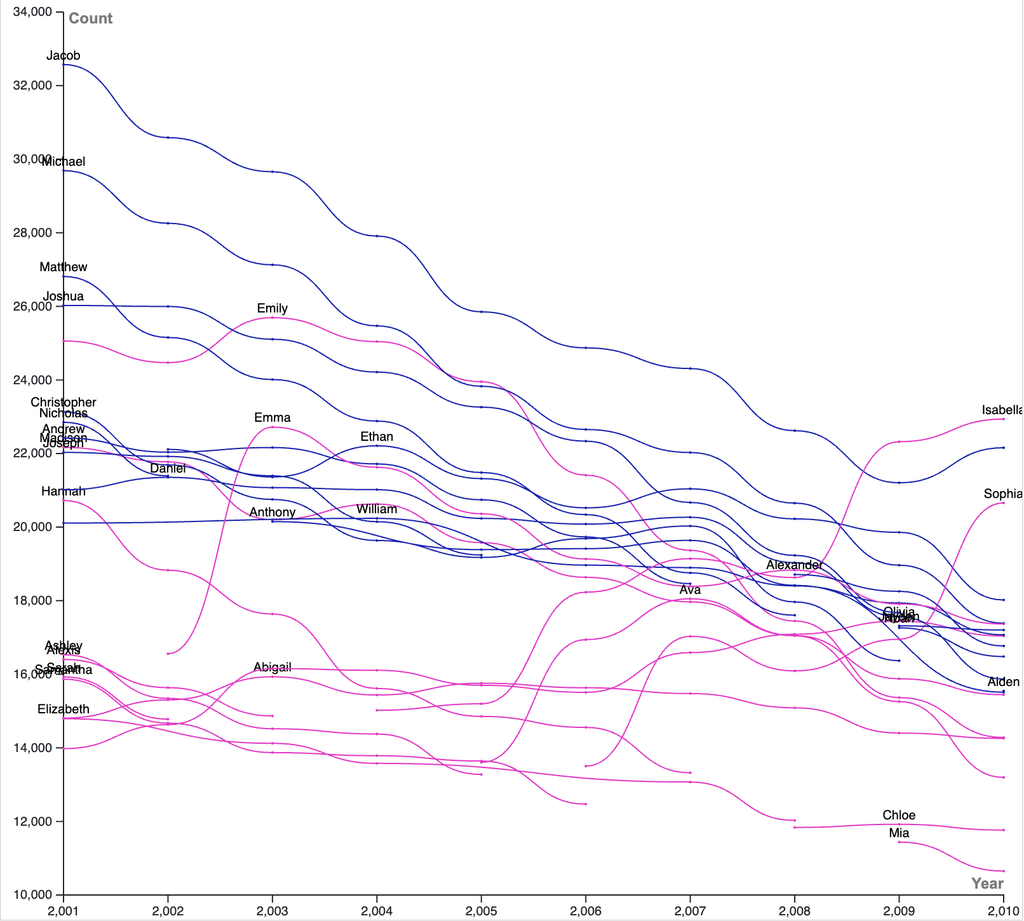
This serves as an example of how information can be used to uncover trends in baby naming practices. This graph is an illustration of trends and patterns and not the explanation of why every individual decides to name his or her baby by that particular name. In this manner, it helps in understanding which names are becoming more or less popular over time.