I chose to visualize the amount of babies born with a biblical name in the top ten. I used a streamgraph to give an idea of the amount of babies with each individual name as well as the amount of babies in general with a top ten biblical name.
To make it easier to follow, I kept the names on the actual streamgraph so it was easy to tell which stream was which name. I also tried to pick warm-toned colors for the traditionally feminine names and cool-toned colors for the traditionally masculine names. Due to this color scheme, it’s easy to see that biblical boy names from the top ten were more popular than the biblical girl names.
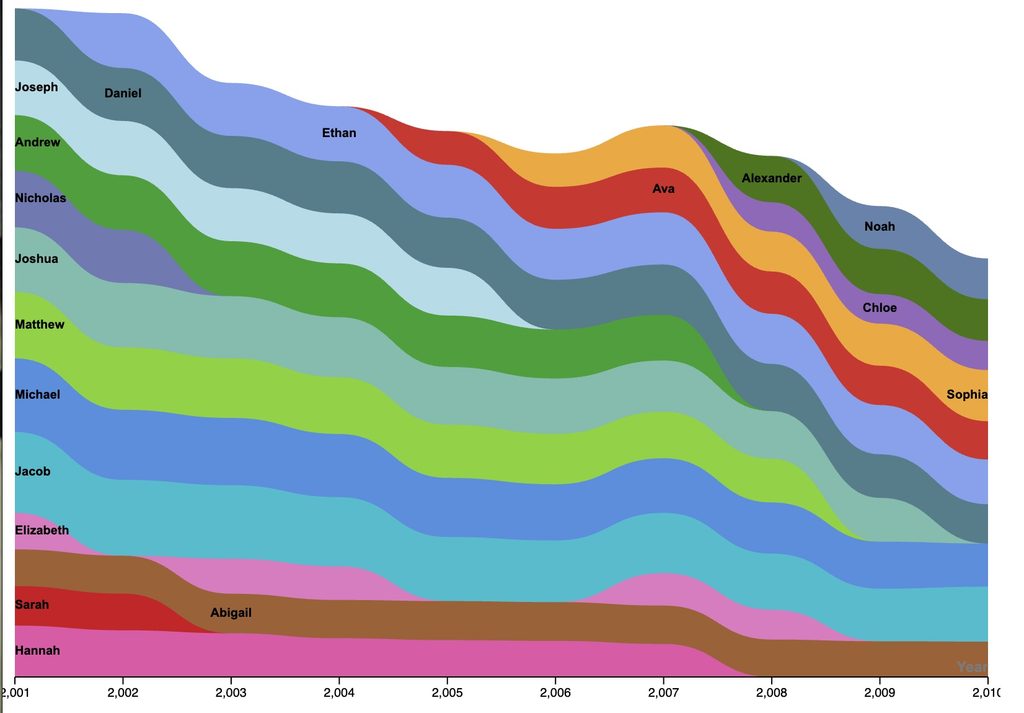
I used RAWGraphs to create my visualization, and while I did create something in the end, I did not find it the most intuitive. I will say that this could be due to a lack of background in data visualization beyond the most basic of bar graphs, but I did not immediately understand which kinds of data could go where beyond the x-axis and the y-axis. I also couldn’t figure out how to remove the commas on the x-axis, so all of the years no longer look like years and can confuse the viewer.
I remember looking at a pie chart during Lin Su Winton’s talk and being baffled by the color scheme. A lot of the colors were very similar, leading me to believe that the sections had something to do with each other. She told me that it was not the case, and the fact that I thought so was an indicator of bad design. She went on to talk about different elements of clarity, including color, but that pie chart stuck with me. Because digital humanites is not just looking at raw data, but interpreting and presenting it, it’s important to not lead the viewer into drawing incorrect conclusions because of how your data is presented. I tried to emulate that by using color to relate the traditionally male and female names to each other.