In my exploration for the class, I looked into Mapping Inequality: Redlining in New Deal America, a digital humanities project by the Digital Scholarship Lab, University of Richmond. This is a website where you can look into maps from the past which show how the neighborhoods in American cities were rated using a scale from A to D by the Home Owners’ Loan Corporation (HOLC). Areas which received a rating of D were colored red.
https://dsl.richmond.edu/panorama/redlining/areadescriptions
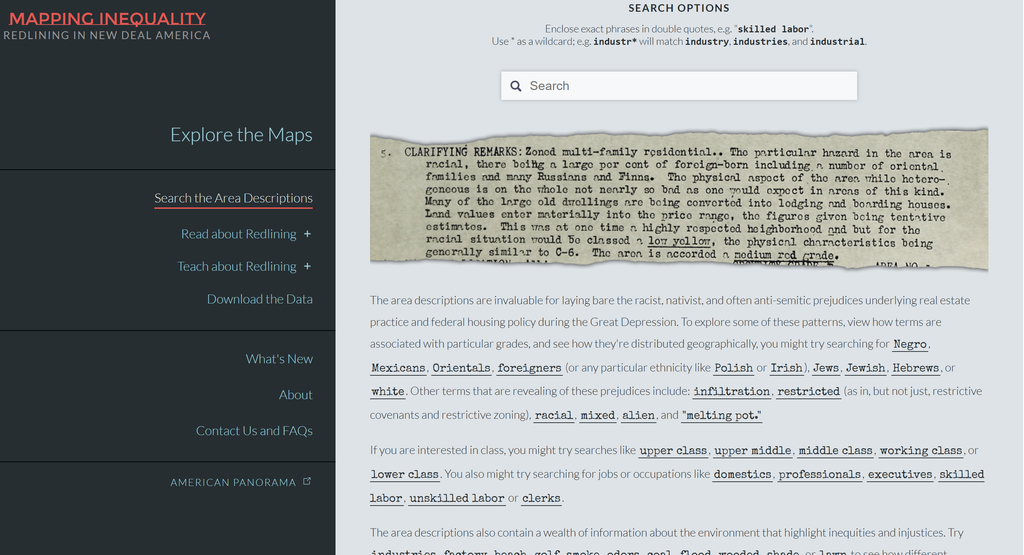
Analyzing the website
The primary sources involved with this project include the HOLC maps and descriptions made in the 1930s. The sources include information regarding the way the neighborhoods were graded and categorized. The project includes the above sources as well as geographical data that enables the sources to be geographically linked.
This project converts the raw data found in the original records into digital data that can be searched and analyzed geographically. Maps are digitized and then linked to contemporary geographic coordinates. Additionally, data from the neighborhoods is structured so that users can choose different regions and analyze the original records. These steps convert archival data that would otherwise be analyzed separately into digital data.
The information is presented primarily through an interactive map of the United States. Users can select cities and zoom into individual neighborhoods. The colored areas make the HOLC grades immediately visible, while selecting an area provides more detailed historical information. This presentation makes it possible to see geographic patterns that would be much harder to recognize by reading the original documents individually.
Questions
Does the site make an argument? If so, what?
Yes. The site demonstrates how redlining was not only an isolated event taking place in individual neighborhoods, but rather a process that occurred as part of a broader system, which operated throughout the whole country. Through the combination of the HOLC maps and descriptions of neighborhoods, the project illustrates the relationship between race and other elements that played a role in assigning grades to the neighborhoods.
What are the components? (i.e essay, interactive map, etc)
There are a number of elements to the project. First, there is the interactive map through which one can explore various cities and access HOLC grading of neighborhoods. In addition, there are scanned historical documents and maps, which include the descriptions of the particular neighborhoods. There is an introduction to the project on the website and some text, which gives the historical context of the whole project. There is also a navigation system, which allows for easy movement through different cities and neighborhoods.