The visualization is based on the change of popularity of some of the most popular baby names in the United States from 2001 to 2010. This dataset is provided by Social Security Administration’s baby names dataset, where the number of newborn babies who have certain names is recorded. It is intriguing for me since I meet baby names every day but rarely think about changes in the popularity of a certain name.
To visualize the changing of popularity of the names, I chose a line graph. In this graph, one line corresponds to one name; on the x-axis is the year and on the y-axis is the number of babies with that name. A line graph is suitable for this type of data because the connection of the observations makes it easier to identify whether there is an increase or decrease in the popularity of the name. Jacob is the most popular name in this visualization, with more than 32,000 babies with this name in 2001, but its popularity goes down gradually during the decade.
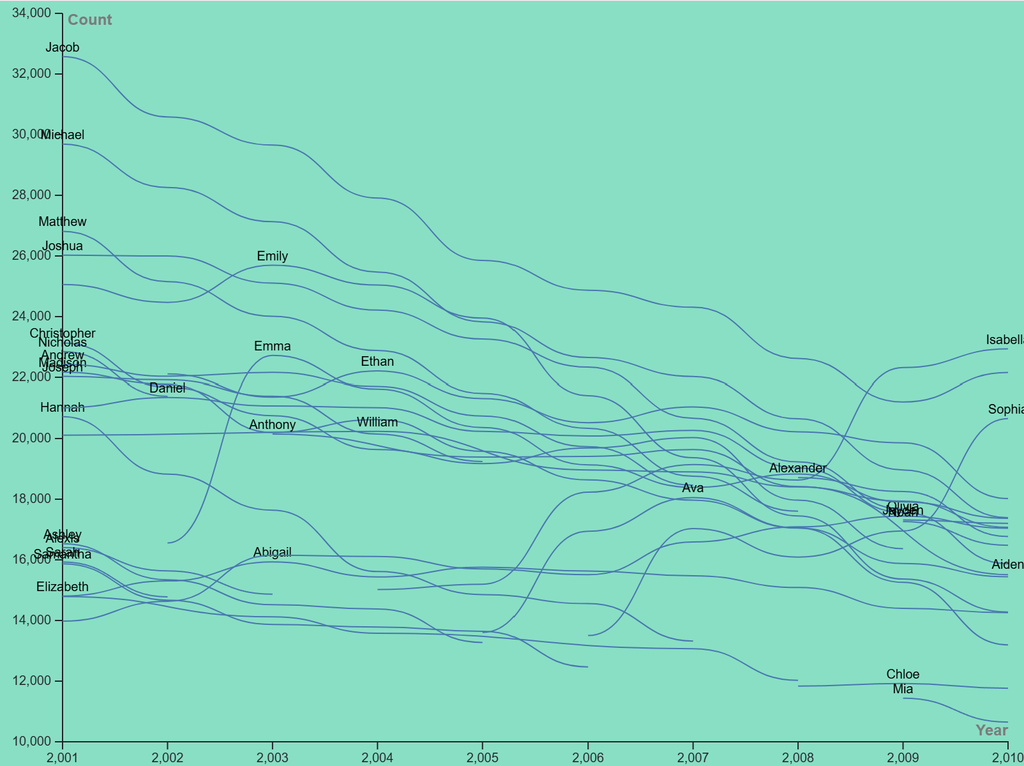
I also adjusted several elements of the default styles. First and foremost, instead of having a separate legend with the names, I decided to display them next to the corresponding lines on the visualization itself. It makes it easier to distinguish different trends without having to go back and forth from the visualization to the legend. Second, I switched to a different color for the background of the visualization to make the data more visible. However, one problem that should be addressed is the overlapping of the labels because of similar values for many names.
In relation to the course, this visualization relates to our readings on Digital Humanities. According to Syme, data analysis could help humanities scholars to step back and take a larger view of what has been going on throughout history. In the same way, my visualization helps show not specific information about individual baby-naming decisions, but cultural trends. The graph could show what has been changing, such as the increasing popularity of the name Isabella. However, it cannot provide reasons behind it.