After downloading the data and playing around with RAWGraphs, I decided to focus on how baby name ranks changed from 2001-2010. I tried out nearly all of the graph types available in RAWGraphs, learning primarily what each of the “chart variables” means and which kinds of data they accept.
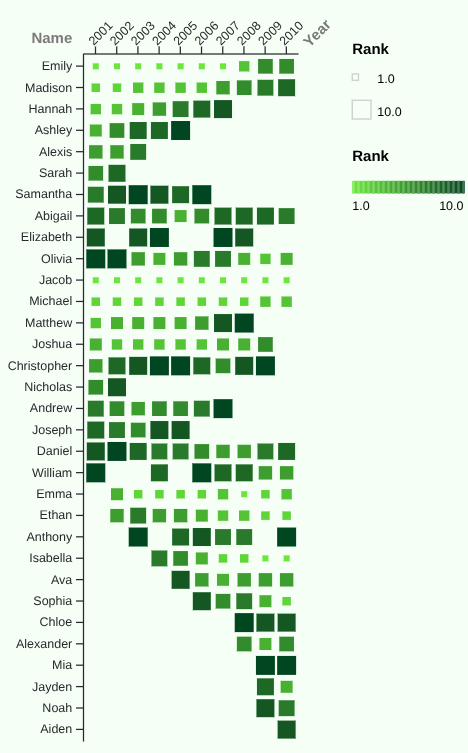
After some revision and deciding what I wanted to portray in my graph, I settled on the graph seen to the left.
It is a Matrix Plot and shows the relationship between baby names and their ranking for a given year from 2001-2010. I liked this type of visualization because it portrays a lot of information in a very uncluttered format. Many of the other graph types I tried out, especially the Bumpchart or the many Line Graphs, were unreadable because of how busy they looked and didn’t end up translating what I wanted.
I also found that a cohesive color pallet for those graph types were very difficult to make because of the shear number of colors needed. With a more powerful visualization tool with better control over settings, I’m sure it could be made to work, but I didn’t personally find the results for this particular data set appealing.
For the color pallet of my final graph, I chose green, with lighter shades representing a higher ranking and darker shades a lower one. I decided to add a colored background for a more cohesive appearence.
While I am generally happy with how the graph turned out, I do have issues with it. My major concern is that without the legend, it is natural to assume that the larger boxes represent higher rankings (closer to one). I couldn’t find a way to fix this issue within the settings, however.
One thing I kept in mind while working on this graph was something Dr. Lin Su Winton focused on during her lecture: keep it simple. I could have added numbers to each of the boxes and solved the issue I described above, but that ultimately would have made it more crowded and less readable. Designing data visualizations to be as approachable as possible is important in science, math, and the digital humanities. It allows more people to understand them and they are, as such, able to reach a wider audience, which is why visualizations are designed in the first place.