Choosing a graph
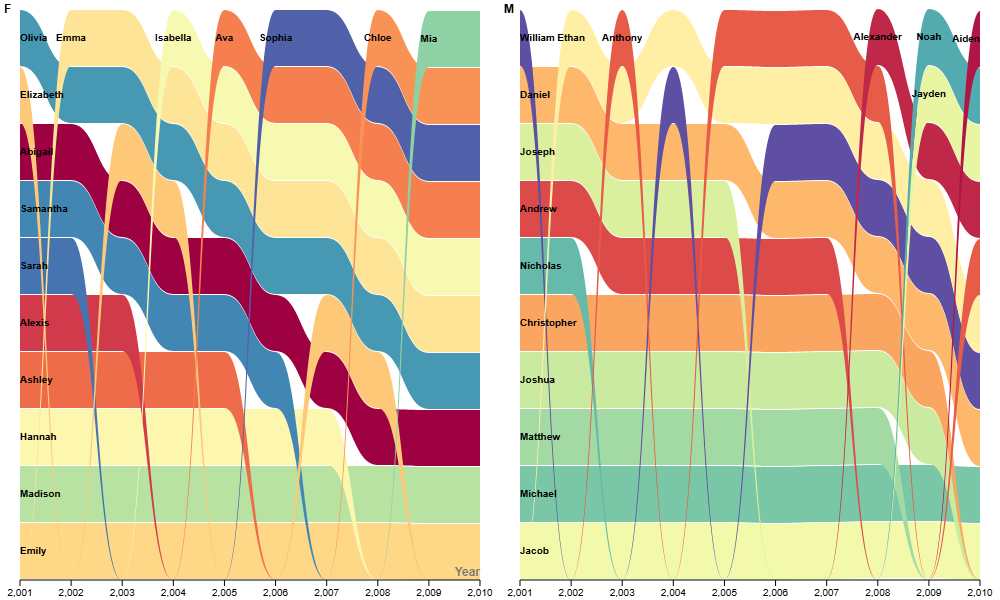
The data set I got is a set of names with their counts and ranks for every year from 2001 to 2010. As the size of the csv file is large, which contains 200 lines of data, it is actually hard to find the patterns by just staring at the csv file. Thus, what I have done was visualize the data set using random different types of graphs and see what it happens. After several trails of visualization, I found that Bumpchart can provide me with some interesting insight to the data set. Specifically, I put time in the x axis, rank in the ranking, and I define name as each stream. As a result, it provides me with the rank of each name as time passes, which indicates the changes in preferences for names in the decay.
Refining my graph:
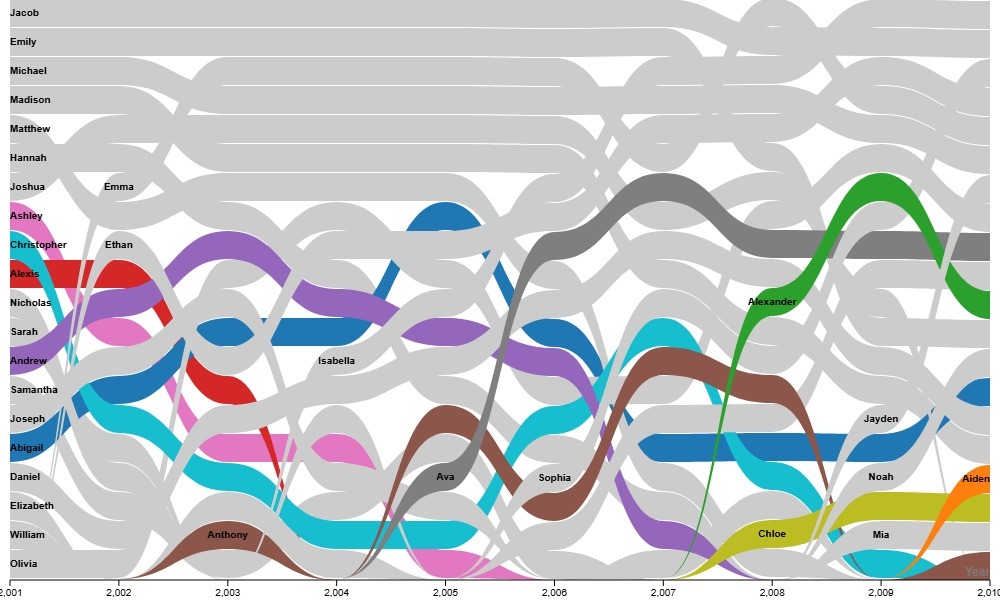
The initial graph I made is fig 1, where many of the names are not colored, the margin of the graph is small and the number of the axes are not fully displayed. In addition, the names for males and Females could be different so that they are not comparable, meaning that I shouldn’t put them into the same column. To solve the problem, I define the gender using a series, which splits the chart into two columns. This makes the comparison within each gender become easier. Then, I increase the margin and change the color to spectral discrete. Finally, I got a much clearer chart for the ranking of names, which is shown below.
Reflection on the reading:
One thing I took away from “What Gets Counted Counts” is that data visualization is not as neutral as I initially assumed. Although the graph generated can somehow show the preference for names, we actually can’t see the detailed stories behind the changes and the reason for it. The visualized process actually simplified too many things. In the future, I may look deeper into the data by searching relating the changes in ranks with some historical events, and hopefully I can get more insight to the data.