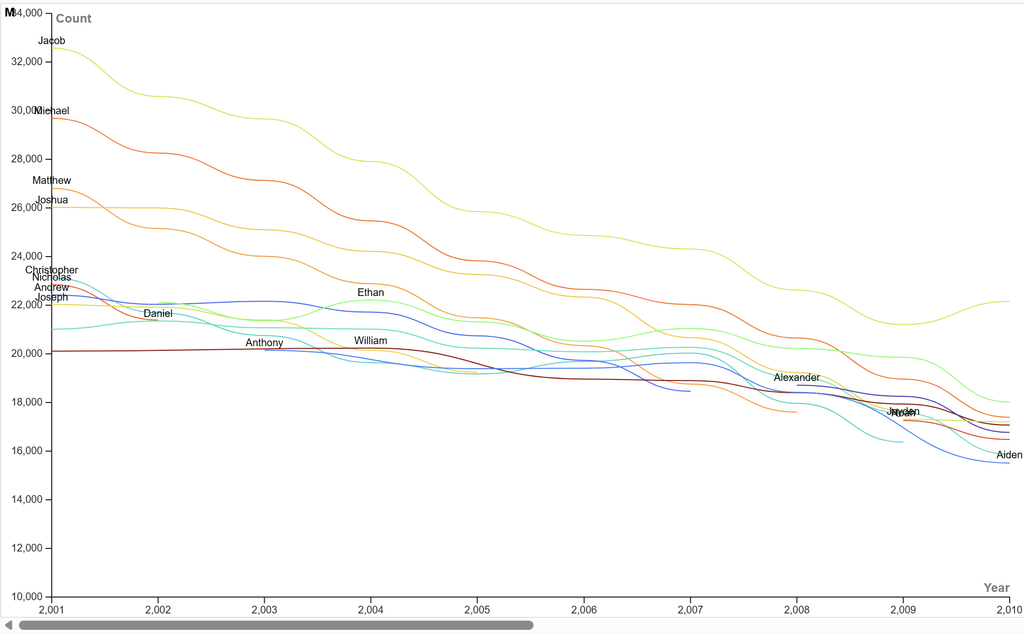
For this project, I chose to visualize the popularity of several common male baby names in the United States from 2001 to 2010. I selected a line graph because it is one of the clearest ways to show change over time, especially when comparing multiple variables. Each name follows its own trajectory across the decade, and the continuous lines make it easy to see patterns—whether a name is rising, declining, or holding steady. A line graph also highlights intersections, which helps reveal moments when one name overtakes another in popularity. I found it interesting that there is a constant decline for every name. This is not do to fewer babies being born but rather as time goes bye the variety of baby names grows and not everyone is naming their baby boy ‘Jacob’ anymore. Another interesting statistic I found was that Jacob was the most popular baby name during those 10 years from 2001 to 2010 despite constantly declining in number each year.
One of the most important improvements I made was adjusting the color palette. In the original version, several lines shared similar hues, which made it difficult to distinguish individual names, especially where the lines overlapped. By assigning each name a distinct, high‑contrast color, the visualization became far more readable. This small design choice significantly improved clarity and reduced cognitive load for viewers trying to interpret the data.
Reflecting on Lin’s lecture, this process reinforced her point that data visualization is never neutral. Every design decision—from graph type to color choice—shapes how viewers interpret information. Lin emphasized how graphs can simplify complex data or, if poorly designed, distort or obscure meaning. Changing contrast, alignment, proximity and simplicity. My experience echoed this: the same dataset can look confusing or insightful depending on how it’s presented. In digital humanities, visualizations often serve as analytical tools, not just illustrations. They help us see cultural patterns, question assumptions, and communicate insights more effectively. By refining this graph, I aimed to make naming trends not only visible but genuinely understandable, demonstrating how thoughtful visualization supports DH’s broader goals of clarity, accessibility, and critical interpretation.