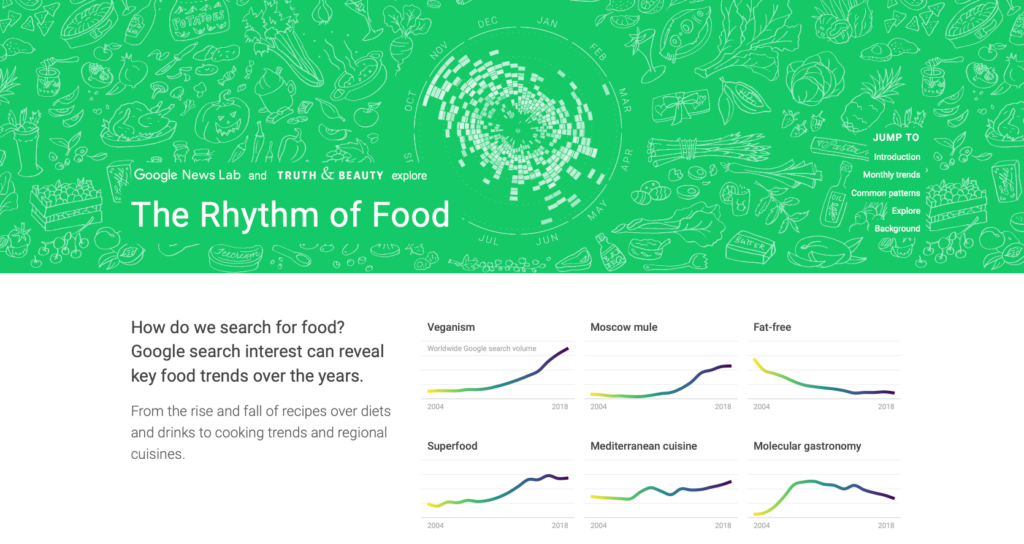
The project I chose is Rhythm of Food which is an interactive data-visualization project created by Google News Lab and Truth & Beauty. It examines Google search behavior surrounding food and uses that data to identify seasonal patterns in what people search for. It displays an interactive visualization where you can look at the trends of different foods searches for different months and years.
Black box:
- The project uses Google Trends search data as its primary source, looking at how often people searched for different food-related topics over a 15-year period. It draws on hundreds of food topics, including ingredients, dishes, recipes, and drinks
- The raw Google search data is organized and analyzed to identify patterns in food-related searches over time, particularly recurring seasonal patterns. Each day is given a certain score out of 100, which represents how popular that search was on that day. It then transforms the numerical data into visualizations, displaying a circular “year clock” to show year trends with the radius and month trends with the circumference.
- The processed data is presented through an interactive website where users can explore different foods and see how interest in them changes throughout the year. Rather than simply displaying tables of numbers, the project uses interactive graphics and visualizations to make the data understandable and engaging to a general audience.
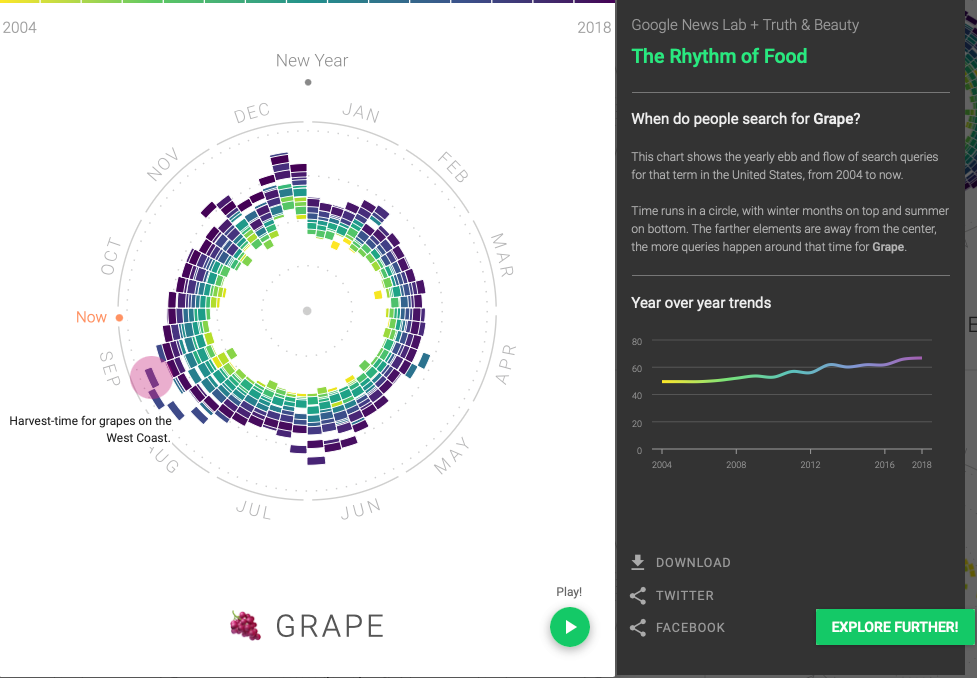
The goal of the project is to identify patterns in pei-ple’s interests in different foods throughout the year. It also connects activity in searches with reasoning, for example national holidays or harvesting seasons for those foods.
I see multiple academic fields in conversation with the project including data science, statistics, cultural studies, and food studies.
One question I have for this is how do these Google searches also reflect whether people are actually eating them, or if it’s just what people are curious about and searching on the internet.