I chose to analyze The Odyssey by Homer, translated by Samuel Butler, which I downloaded from Project Gutenberg. I decided to use Voyant Tools and Google’s Gemini to explore how different computational approaches can reveal patterns in a literary text. I was particularly interested in how word frequency and repeated phrases could help identify important characters and themes.
For my first method, I uploaded the text into Voyant Tools and created a word cloud displaying the 50 most frequently used words. Some of the most prominent words were “Ulysses,” “said,” “Telemachus,” “men,” and “house.” I found it interesting that the names of major characters appeared so frequently, but the prominence of words like “house” and “home” also connects to the central theme of Odysseus’ journey back to his family. The word “said” also stood out to me because it suggests how much of the story is told through conversations between characters.
For my second method, I used Google Gemini to create a bar chart showing the most frequently repeated phrases in the text. According to Gemini’s analysis, “to the house of” appeared 27 times, while “the house of Hades” appeared 19 times. Another phrase that caught my attention was “rosy-fingered dawn appeared,” which appeared 12 times. This highlights the importance of repetition in epic storytelling, something that was not as obvious from the Voyant word cloud. However, I would need to verify Gemini’s counts against the original text before treating them as reliable. I also had to resubmit the prompt with minor tweaks a few times. For example, the first chart it made had the phrases “eat and drink”, “to eat and drink”, and “enough to eat and drink”, so I had to resubmit it a couple of times to filter out phrases that were that similar by merging them together.
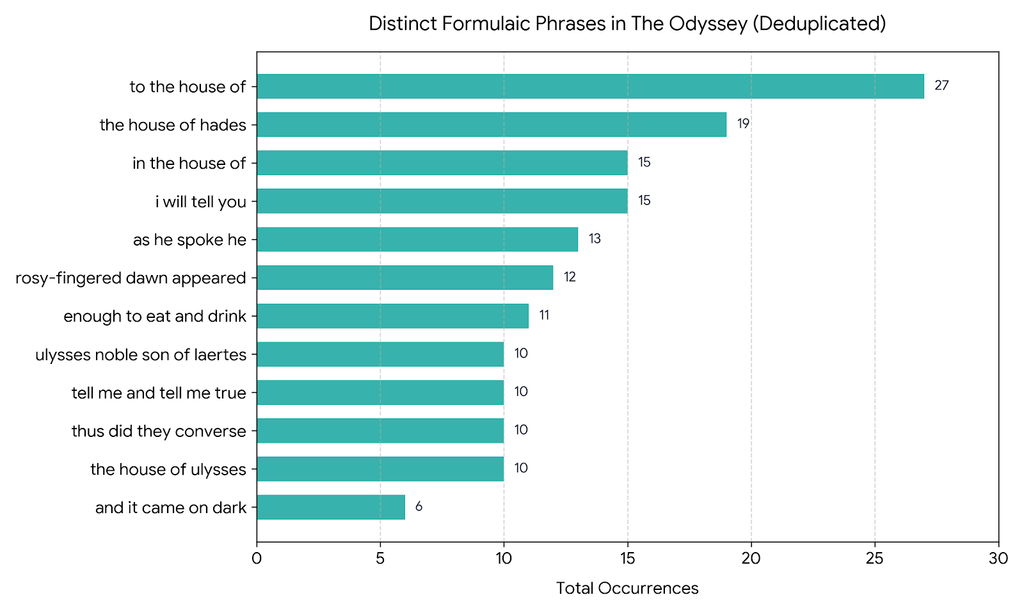
Code from Gemini Most Frequent Phrases Chart:
import matplotlib.pyplot as plt
import pandas as pd

# Deduplicated data (merging overlapping substrings like "to eat and drink" and "enough to eat and drink")
phrases_data_clean = [
    ("to the house of", 27),
    ("the house of hades", 19),
    ("i will tell you", 15),
    ("in the house of", 15),
    ("as he spoke he", 13),
    ("rosy-fingered dawn appeared", 12),
    ("enough to eat and drink", 11),  # Merged with "to eat and drink"
    ("the house of ulysses", 10),
    ("thus did they converse", 10),
    ("tell me and tell me true", 10),
    ("ulysses noble son of laertes", 10), # Merged with "noble son of laertes"
    ("and it came on dark", 6)
]

df_phrases_clean = pd.DataFrame(phrases_data_clean, columns=["Phrase", "Count"]).sort_values("Count", ascending=True)

plt.figure(figsize=(10, 6))
bars = plt.barh(df_phrases_clean["Phrase"], df_phrases_clean["Count"], color="#38B2AC", edgecolor="none", height=0.65)

for bar in bars:
    width = bar.get_width()
    plt.text(width + 0.4, bar.get_y() + bar.get_height()/2, f'{int(width)}',
             va='center', ha='left', fontsize=10, fontweight='bold', color='#2D3748')

plt.xlabel("Total Occurrences", fontsize=12, fontweight='bold', labelpad=10)
plt.title("Distinct Formulaic Phrases in The Odyssey (Deduplicated)", fontsize=14, fontweight='bold', pad=15)
plt.xlim(0, 30)
plt.grid(axis='x', linestyle='--', alpha=0.5)

plt.tight_layout()
plt.savefig("odyssey_frequent_phrases_deduped.png", dpi=300)
print("Deduplicated chart generated.")
Comparing these two methods made me think about both the benefits and limitations of computational text analysis, especially in the Age of AI. Voyant provides a relatively straightforward way to visualize word frequencies, while Gemini can quickly generate more detailed analyses and visualizations. However, AI-generated results can appear convincing even if the underlying information is inaccurate. Additionally, the frequency of a word or phrase does not necessarily determine its importance to the story. Ultimately, I think these tools are most useful when they support human interpretation rather than replace close reading.