data visualization process
When I first examined the dataset, I realized it provided the count of a consistent set of male and female baby names over a multi-year time period. My goal was to show the popularity trend for each name across both genders. I initially tried using line graphs and stacked bar charts, but neither worked well: the line graph turned into a tangled mess of overlapping lines, and the stacked bar charts made it difficult to trace the flow and individual rank changes of specific names across the years. I ultimately chose a bump chart style, which proved to be the best fit because it naturally tracks rank position changes over time while visually representing relative name volume through continuous flowing streams.
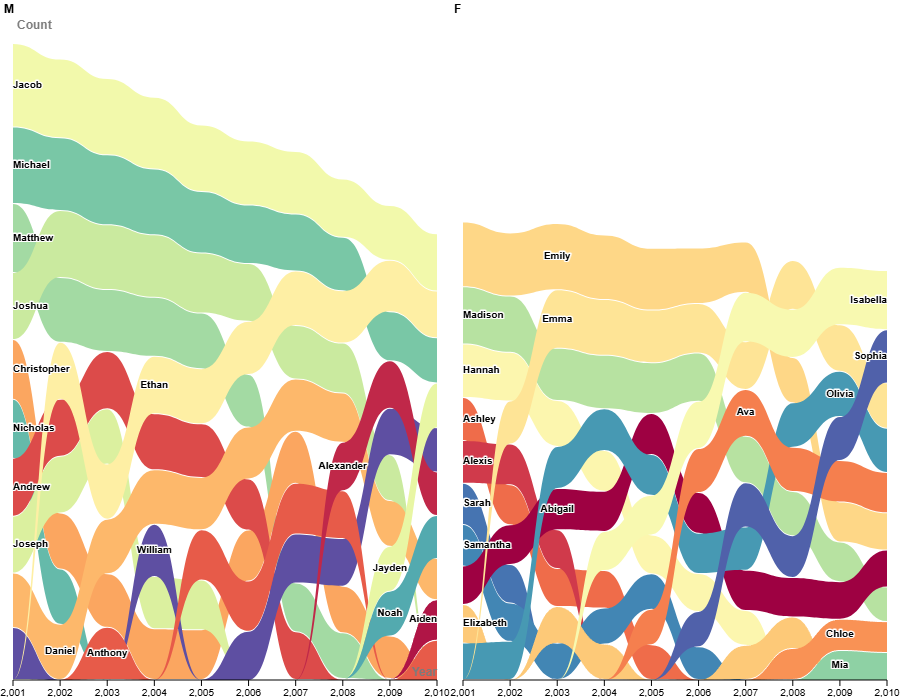
To refine the visualization and ensure maximum clarity for the viewer, I implemented several targeted design improvements. First, I applied a distinct color scale to differentiate each individual name path, making it intuitive to follow a single stream as it moves up or down over the decade. Next, I expanded the overall size and proportions of the graph to give the elements room to breathe, ensuring that every text label could fit without overcrowding. Finally, I added subtle white margins around the inline name labels, creating a sharp contrast barrier that keeps the typography completely crisp and legible against the colorful background streams.
reflection on reading
My visualization process directly connects to the Data Feminism chapter “What Gets Counted Counts“, which emphasizes that data collection, categorization, and representation are never neutral actions. They actively shape what society values and sees. In Digital Humanities, visualization is treated as a critical, interpretive practice that makes these underlying structures legible. By moving away from unreadable line graphs and stacked bar charts, I resisted automated defaults to intentionally highlight how gender categories operate over time. Transforming the dataset into a faceted bump chart with high-contrast, inline labels directly reflects DH data values. It ensures the human choices behind the data remain accessible, foregrounds gendered dynamics clearly, and resists abstract visual clutter.
Looking ahead, future data visualizations for DH projects should go beyond simple charts. We need to question where datasets come from, highlight missing information, and combine real stories with visual trends.