This image maps each scholar, ruler, or otherwise important early British figure (that people could reasonably track) that Francis Bacon, a major developer of the scientific method, worked with, was friends with, or otherwise met.
… and this:
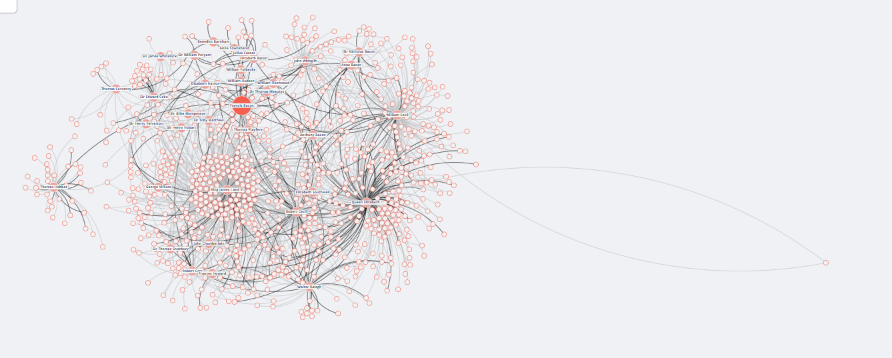
Is everyone who is within two degrees of that. So, all of the important people who came into contact with someone important who came into contact with Francis Bacon. The site continues this up to and (perhaps even exceeding?), as the name suggests, six degrees of separation.
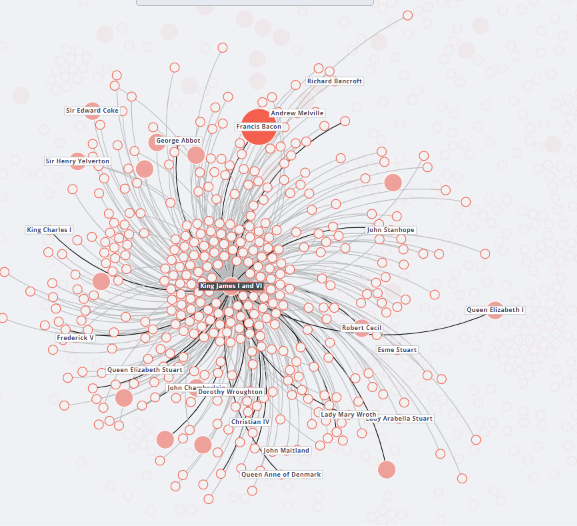
Due to their source (more on that below), and the nature of how human interaction works, they of course could not map everyone important.
I did expect a few more connections to, say, King James I, but for the most part, this seemed pretty comprehensive. Don’t get me wrong, what is pictured here is a lot, but he’s the king. He would have talked to a lot of people.
This was quite an impressive project to stumble upon! It is also heavily community backed. The project still accepts contributions for possible missing links.
But how did they make it?
Pain and Suffering.
(or so it seems )
In seriousness, though, the developers kindly linked their GitHub repositories, one containing all of the code used to make the site itself, and another containing the network and database construction logic. They wrote a paper detailing their entire process, including how they used their main source, the Oxford Dictionary of National Biography. I will explain these as best I can here, but the real explanations can all be found using these links:
We will break down this website into four components: Tech Stack (the programming assets), Sources (the English assets), Processes (the non-programming assets), and the Presentation (what we see.)
Tech Stack
AngularJs

AngularJS was a historically significant JavaScript, very popular around the time this website was made (2015.) It is no longer supported, but at the time was one of the pioneers of separating code that worked with logic and code that separated the display.
Ruby on Rails

Ruby on Rails was another framework for making webpages in 2015. It was another pioneer of making the connection between your logic (e.g., getting stuff from databases) and your presentation (mapping the names onto a nice looking chart) less of a headache.
PostgreSQL

PostgreSQL is a very old (but still functional and popular) open-source database used by millions of people. It can manage billions of rows while still being quite fast.
D3.js

R

R is the language that people use to work with data when they don’t want to use python (because python is slower.) The language is commonly seen in biology and statistics.
Sources
Oxford Dictionary of National Biography (ODNB)
The ODNB is a gigantic list of biographical descriptions of people from Britain; this website focused on the people alive from 1500-1700. It’s worth noting the pioneering significance of the database itself. The paper explaining the work process mentions that it was deemed “the first to exploit the potential of electronic publication on so vast and imaginative a scale.”
JSTOR?
They menton that they used some JSTOR collection of early documents. I didn’t dig too much into this, because it seems like they mostly pull from ONDB. It’s worth mentioning though, just in case.
Process
The process itself, according to the README files of the repository, are broken into three steps: Preprocessing, which turns raw ODNB entries into R data structures; “NER”, which uses Stanford’s Named-entity Recognition (NER) Tool on the data; and finally Postprocessing, which turns the name processing results into network-able entries.
Preprocessing
The data is gathered from the database using the following bash command:curl -o ../../../../data/ODNB_raw/HTML/file_#1.txt "http://www.oxforddnb.com/templates/article.jsp?articleid=[1-99999]"
tar -zcvf ../../../../data/ODNB_raw/HTML_ZIP/ODNB_text.tar.gz ../../../../data/ODNB_raw/HTML
The data they receive is raw html page information (rather than trying to access some sort of api), and they proceed to spend a bunch of fancy programming tricks (like regular expressions, an awesome tool to use in most situation) to format the data into R structures they can easily manipulate.
Named-entity Recognition
Named-entity Recognition (NER) refers to tools that can ask what kind of a thing a noun refers to, if applicable. So, a text like “Francis Bacon went to Trinity College” could extract something like "Francis = PERSON" "Bacon = PERSON" ... "Trinity = ORGANIZATION" "College = ORGANIZATION" ... "Cambridge = LOCATION". They use two different types of NER algorithms for extra precision, one published by Stanford, and another from a (defunct??) collection of language tools called lingpipe. This was needed because one algorithm might erroneously detect “Sir” as a name (in Sir Francis Bacon).
The repository then talks about the long process of normalizing the data (= making it not a mess), and mentions that manual human intervention was required for some tasks, like deduplication (though that could have been solved with regular expressions imo), and instances where two people share the same name (I imagine that was quite annoying.)
Postprocessing
Alas, even though they had, in theory, everyone in a structure that could be mapped, some data still couldn’t be confidently plotted; the paper mentions how some people could be counted as “confounding variables”, as described with King Charles I (try reading this with a pen and paper):
George Villiers, Duke of Buckingham (1592-1628), knew King Charles I (1600-1649), and Charles I knew Prince Rupert of the Rhine (1619-1682), but Buckingham and Prince Rupert – whose lives only barely overlapped – never met. Because Prince Rupert and Charles I are connected, they will tend to be mentioned together in source documents. […] Likewise if Charles I and Buckingham are connected, mentions of Buckingham predict mentions of Charles I. But in the case of no direct tie between Prince Rupert and Buckingham, as here, their names may still correlate due to mentions of Charles I. Despite such correlation, mentions of Buckingham convey no information about mentions of Prince Rupert not already accounted for by mentions of Charles I.
Christopher N. Warren et al., “Six Degrees of Francis Bacon: A Statistical Method for Reconstructing Large Historical Social Networks,” Digital Humanities Quarterly 10, no. 3 (2016)
To solve such a mess, they had to use math (gasp). The method they used was called the “Poisson Graphical Lasso”, which sounds very cool. I didn’t look into exactly what was going on, but in essence it figures out what relationships are most likely true given a lot of different datasets (people) with a relatively low number of connections (nobody knows nearly all of Britain.)
AND THEN
After all of that, they did three rounds of additional validation. One tested to see if the descriptions of the people seemed to make sense with the type of interaction they were having. It wouldn’t make sense if the network said a judge was employed by a chef, but if two people sharing lot’s of words weren’t connected, something may have been missed. Then they did some more statistical checking (I would recommend reading the paper if you are interested), and then brought real, live humans in to verify stuff.
Presentation
Building the stuff that could be shown
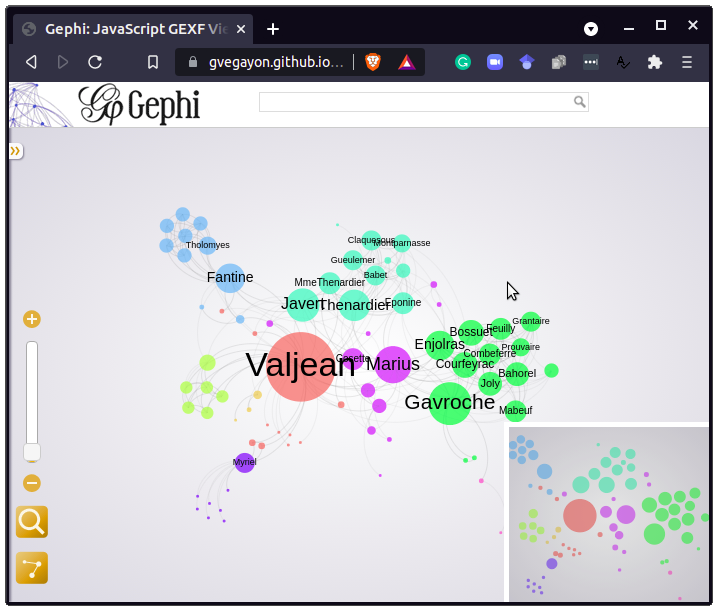
R is very good at building graphs and displaying them, so this was an easier (but perhaps not entirely problem free) task. They used the rgexf library to map relationships, which seems perfectly built for text heavy graphs like “Six Degrees of Francis Bacon”. The image to the right is an example from the repository, which plots the names from Les Miserables.
Supposedly they also use another library called Gephi, but it was not documented where or how this library was actually used by the part of the code that actually builds the website (or I missed it, very possible.)

Actually showing the stuff
The two main frontend components were Ruby on Rails, which handles collaboration between the database of links and the JavaScript. I am still not quite sure how the R graph interacts with the graphical drawing tools, database, and Ruby (which connects a PostgreSQL database with the D3.js stuff) (maybe the PostgreSQL contains the components to whatever graph file the R code exported?) but the rest of the code is generally composed of allowing the user to explore and actually use the data.
I know I missed some things, but I think in general, with the various README pages and Papers on the website, the creators of this project made their process as transparent as possible, which is awesome. I hope at least some of this made sense; I implore you to read more about it using the links I put above if you are interested.
question
If one were to try to construct such a web today, would it be easier given how much correspondance is online and available? Or would it be much, much harder due to the exponentially higher number of connections we have with people nowadays?