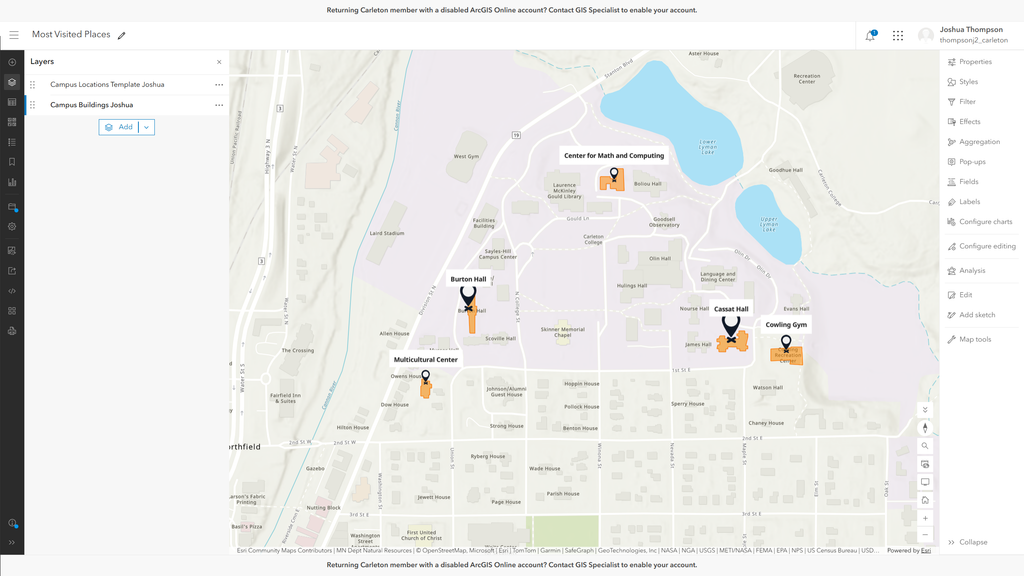
For this week’s lab, I built a web map in ArcGIS Online of the five places I spend the most time on campus: Cassat Hall (my dorm), Burton Hall (where I eat), Cowling Gym, the Center for Math and Computing, and the Multicultural Center. I recorded each location’s coordinates, address, category, and how many days a week I visit in a Google Sheet uploaded it as a CSV, and traced each building’s footprint as a separate polygon layer. I sized the points by how many days a week I visit, so Cassat and Burton stand out while the academic buildings are smaller. I also set up pop-ups that turn each row into a sentence, like “Cassat Hall is one of my regular spots on campus… I’m here 7 days a week.” I wanted the map to read like a snapshot of my routine, not just dots on a campus.
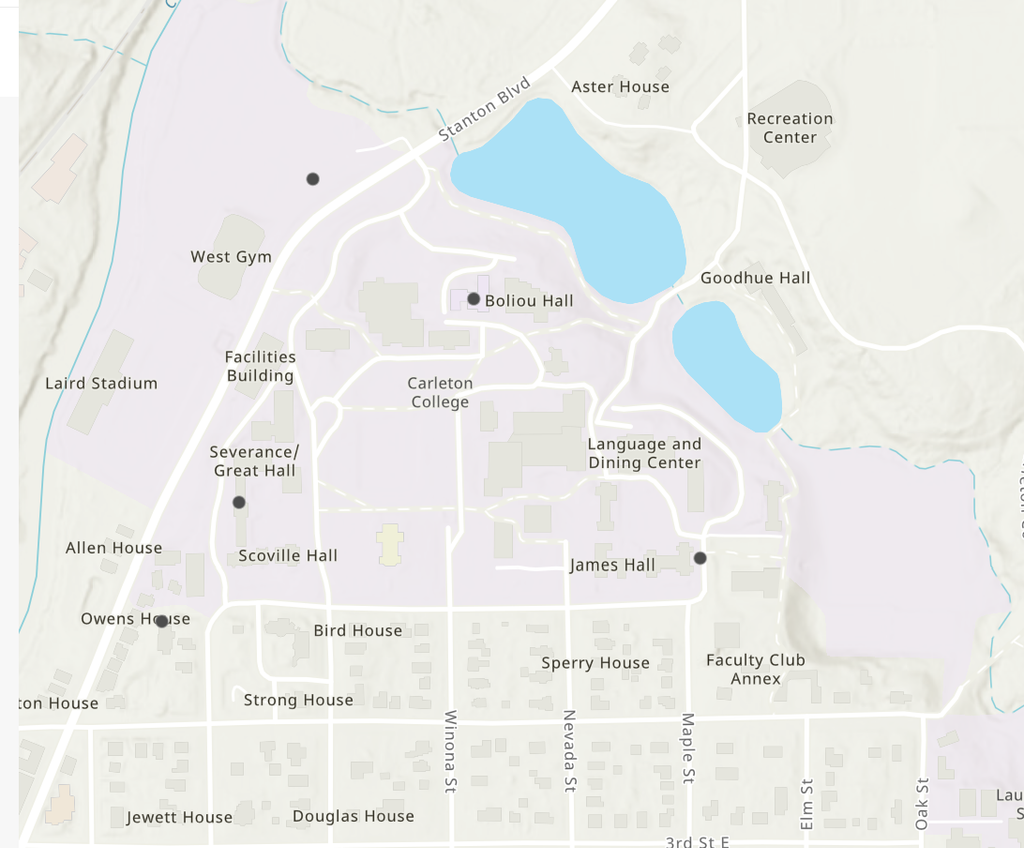
Getting the points in the right places took longer than expected. When I first uploaded the CSV, some points landed in the wrong spots, and the pop-ups showed coordinates rounded to two decimals (44.46), so I assumed ArcGIS had cut off my data. It turned out that was only a display setting: the full coordinates were stored, but the interface showed a rounded version. The real problem was in my spreadsheet. Burton Hall’s coordinates had ended up on the Cowling Gym row, and Burton’s own row pointed to an empty field near Stanton Blvd. Even after I fixed the CSV and re-imported it, a few points were still off, so I ended up moving them by hand with the Edit tool. It showed me that a map can look authoritative and still be wrong. ArcGIS put my points exactly where my data said, with no warning that anything seemed off, and I only caught the errors because I know where these buildings are.
I think web mapping is powerful for digital humanities because it puts information in a spatial context people can explore. Even a small personal map like this one tells a story about how one student moves through campus, and combined with historical sources, could show how a place has changed over time. My experience is also a reminder that maps are built from human choices and human mistakes, so they need the same critical reading as any other source.
As for ArcGIS Online itself, it can do a lot: editable layers, styling based on your data, custom pop-ups, and publishing as a web app without any code. But the interface can be confusing, and some features aren’t obvious, like the decimal display that convinced me my data was broken. For a quick, polished, shareable map it worked well, but it rewards careful checking.
Hi Joshua, I really appreciate that you added the detail within the pop-up about how often you visit each location. It adds a lot of personality to your map! I also agree that ArcGIS has a confusing interface, and I wonder if it has a pretty steep learning curve (similar to my experience with Fusion earlier in the term). If they made the tool a little bit more straightforward, it might be even easier for people of different backgrounds and skill levels to get involved with digital mapping, which seems ideal.
Joshua, I really appreciate the pop-ups you added; they make the map feel super personal. I think the sizing based on frequency is an excellent way to display your weekly routine. I’m glad you mentioned having to drag the coordinates to their proper locations because mine were slightly off too, and I forgot to mention that. If you were not as familiar with Carleton, this could be a pretty serious problem.
Great post, Joshua! I love how you scaled point sizes by frequency of visits to visually show your daily routine; it really brings the spatial data to life beyond basic markers. Your takeaway about maps inheriting human error is spot-on for digital humanities. Spatial tools often look so clean and authoritative that it’s easy to forget the raw data can still be faulty behind the scenes. Navigating those subtle ArcGIS interface quirks (like the truncated decimal display and spreadsheet row mix-ups) is a classic rite of passage when building GIS projects.
I love the icons that you used for each building! I also think that the popups were a great idea. When I put in my own data, I also found that some of the points were off, such as one of the buildings’ points being across the street from the actual building. I don’t think I even would have noticed if the basemap didn’t have the buildings already on it. I definitely agree that we need to remember that all maps and data visualizations can be flawed, as they are ultimately human made.
I really like the way you made the size of the icon reflect how often you visit each building! I ended up doing something very similar. I am also glad that, while my experience was much smoother, you were able to figure out and remedy the google sheets issue, as I could see that being quite confusing. I also agree that despite a digital map having the ability to include layers of much more info than a physical map could, it still requires the same degree of scrutiny!