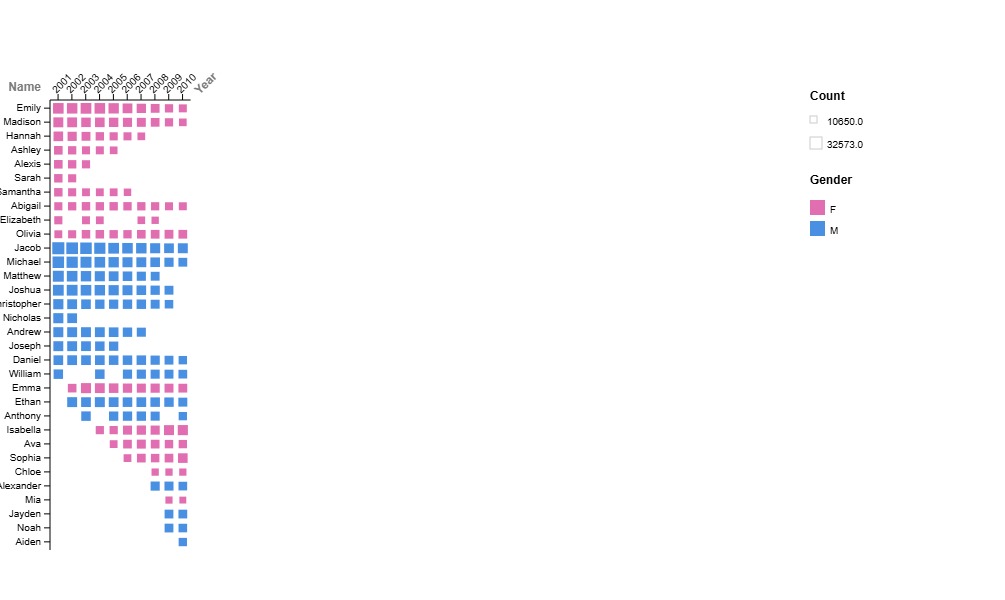
I chose to try to visualize as much information as I could, though my main focus was showing the change in popularity over time for various names. By using a matrix plot in RAWGraphs, the visual representation of popularity was clear by the size of the squares, and time was easy to include as a variable. I wasn’t sure whether I preferred the year to be on the x-axis or y-axis, so both versions are included in this post. On one hand, having the year on the x-axis makes it similar to a timeline format, where time increases from left to right. However, this makes the graph very tall/steep because of how many names there are, and it feels more natural to have the year on the y-axis because of the orientation.
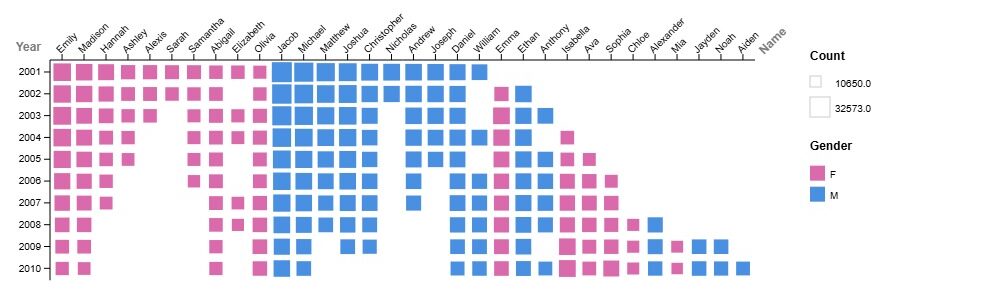
I added the legend to the right because it makes it clear that the larger size of the squares means the name is more common. Originally, I had used rank as the variable determining square size, but this was confusing because the system registered 1 as the smallest, which is the opposite of what being ranked first actually means. Once I switched the variable to count instead, it became much clearer. However, I did not like that the legend contained relatively unimportant numbers as the labels; I know that it represents the highest and lowest counts, but I wish there was a method built into RAWGraphs that allowed me to edit the legend labels. This is something that points me to prefer data visualization methods that consist of coding, because while they’re a bit more time-consuming, they allow for much more personalization.
I also color-coded the squares based on gender, which wasn’t necessarily the most important aspect of the data, but I found that it added additional information. It also made the graph more aesthetically pleasing, particularly considering that regardless of gendered expectations, pink and blue together often relate to babies, and as such, it is immediately apparent what the graph is supposed to represent. This is similar to what Lin talked about in class, where we want the graph to present sufficient information, but also be simple enough to digest and clearly understand what it’s supposed to represent. Additionally, she mentioned that one benefit of data visualization is how much quicker people can gather information (as opposed to just a list of numbers or something similar). By changing the colors, the information is even more easily and quickly understood.