When it comes to visualizing qualitative data, there are various graphs to consider. I believe a bar graph is the most ideal form of data visualization for this data set. In this case, it is the amount (number) of babies who are given a specific name. I found it important to group each graph by year instead of making one individual graph because it would have been a little difficult to notice which name stands out.
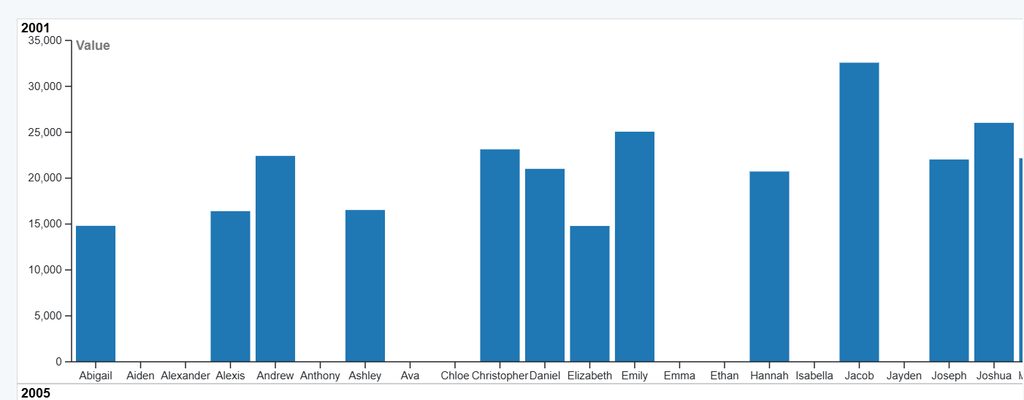
Creating a graph for this data set wasn’t as simple as I thought. There were so many parts that I desired to adjust, but I had to focus on the most important ones. I figured since the main point of the graph was about what the most popular name was, it was not a huge priority to know the rank. I did not consider it necessary information to understand the data. With that, I decided to make the y-axis the “value” instead of the rank. The rank is based on the highest amount of names for each gender (there are 10 names for each gender). If the prompt was more specific focused on what the most popular name each year per gender was, I most likely would have kept it. The value actually provides information on how many babies were given a certain name and I can see from how long the bars are, which name was most common.
The major point that Lin mentioned was “CAPS”- which stands for “Contrast, Alignment, Proximity, and Simplicity”. All of these components are definitely important, but what I mainly wanted to focus on in my graph was “Simplicity”. I wanted to create something that readers/visualizers could easily digest. When making this graph, I had to choose what would fir I believe the most crucial aspects of the graph are the year, name, and value. I also had to increase the width of the graph because the names were squished together. That initially made it difficult to distinguish what each name was. When I think about the simplicity component, I receive it as something that is easy to comprehend, but detailed in an organized manner. So, I believe this visualization captured the essence of an informational, but also concise graph.