For this week’s data visualization exercise, I used the dataset of the ten most popular baby names in the United States from 2001–2010, derived from data collected by the Social Security Administration. I created my visualization using RawGraphs and chose a line chart to show how the number of babies receiving each name changed over the decade.
A line chart seemed like the most appropriate choice because the dataset contains observations across time. Connecting each name’s yearly observations makes it easier to see trends rather than simply comparing individual values. One thing that immediately stood out to me was how much the popularity of certain names changed. Matthew, for example, began the decade with about 27,000 babies receiving the name but dropped put of the top ten by 2009. Other names entered the top ten later in the decade, which explains why some lines begin or end partway through the graph. The visualization therefore shows not only changes in the number of babies receiving a name, but also changes in which names were popular enough to appear in the dataset.
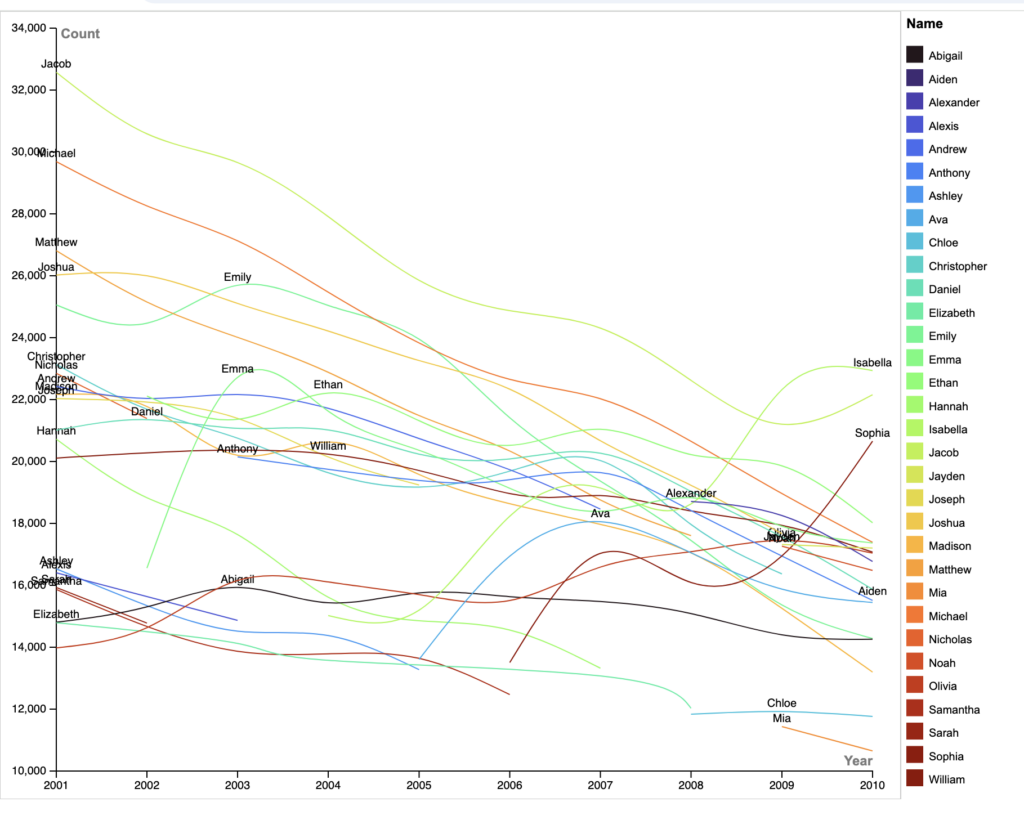
I made several changes to RAWGraphs’ default presentation to improve clarity. Most importantly, I sorted the names by color and added the legend so the chart would be easier to follow. I also added labels directly to the lines so viewers can identify names without constantly referring to the legend. I adjusted the chart dimensions to give the lines more room and made sure the years were displayed clearly along the x-axis. Even with these changes, the number of names creates some visual clutter which is a little disappointing. This reminded me of one of my key takeaways from Lin’s lecture: sometimes less is more.
I think this exercise also connects well to Digital Humanities because it demonstrates how visualization can transform a relatively simple dataset into something that reveals cultural patterns. A spreadsheet can tell us how many babies received each name, but the visualization makes shifts in naming preferences over time much easier to recognize. In this way, data visualization is not simply a way of presenting information; it can also become a method for asking questions about cultural change and human behavior.