For my data visualization project, I decided to represent how the rankings and overall count of girls’ names in the United States changed from 2001 to 2010 by making a bubble chart on Flourish. After browsing for a while, I noticed the bubble chart, which reminded me of the graphs in Hans Rosling’s TedTalk, so I decided to explore. I really liked the interactive elements this chart offered; if you hover over a bubble, it will tell you the basic stats about the name, including the specific total count, rank, and year, and if you click on one of the numbers in the bar across the top, it will hide every bubble in that ranking category, permitting focused examination. I also found it helpful how this chart allows for much visual comparison. For example, I was able to manipulate the size and color of each bubble so the viewer could quickly and easily gather information.
I thought a lot about Lin’s lecture while creating my graph. Specifically, I kept in mind what she said about what types of things made graph designs fail, thinking back to the bad examples she showed. In many of those examples, data was obstructed or difficult to understand—one that sticks out in my mind is a 3-D pie chart.
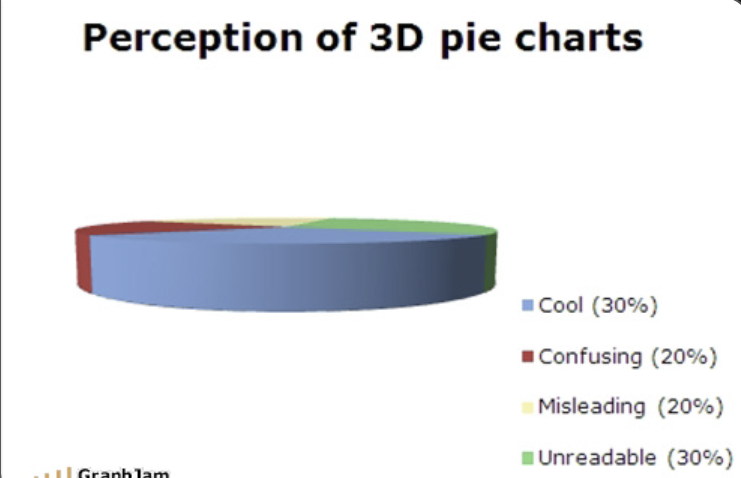
Clearly not great for data visualization. This drove a lot of the changes I made to the default bubble chart design. For instance, under the default, all the bubbles were a similar shade of teal, so it was hard to distinguish which ones belonged to which ranking category. I changed this to a more varied color palette, and added borders so the lighter colored bubbles were more visible. Additionally, the default bubbles toward the left side obscured the names on the y-axis, so I fixed the margins to make them readable.
Lastly, another thing Lin said during her lecture was that exploration can be an important part of data visualization. Since I’d never done an activity like this, I had to do a lot of exploring: looking at the graph, seeing what story it told, and comparing that to what I wanted to show. This process, for me, became not only analytical, but creative, as I had to think about the rhetoric of my design, and the different elements that went into its presentation, just like a digital humanist.