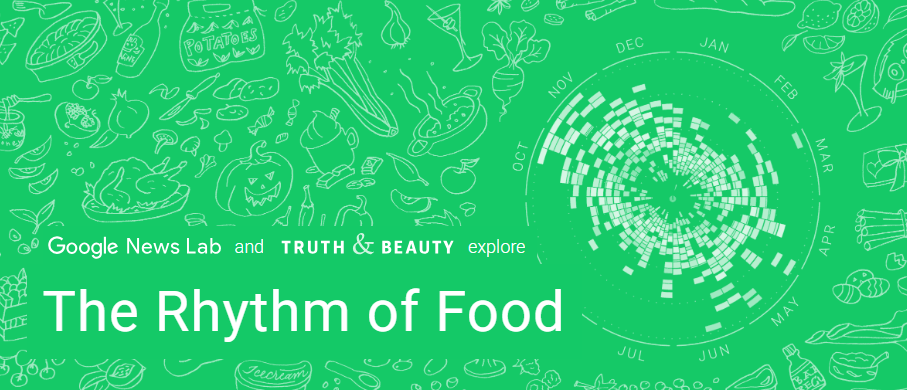
I decided to look into the website The Rhythm of Food, which caught my attention because of its interesting name and kept my attention with its interesting and well-presented data. The project essentially displays the data behind when certain foods are popular, or at least when they are being searched for on Google! It demonstrates monthly trends, cultural facets, and other interesting facts about food and society. The site is a collaboration between Google News Lab and Truth & Beauty.
SourceS
The website compiles data from Google Trends, which is a database from Google that tracks the popularity of keywords and topics based on how much they’re being Googled. It also uses information from FooDB, which is a database of food-related information, which helped to contextualize the data from Google Trends.
ProceSSeS
The team behind the Rhythm of Food site essentially just visualized various different data points, as well as organizing all of the data visualizations into categories that could be explored (i.e. seasonal foods, differences regionally, and even graphs that resemble the food they represent). They took information that is publicly available from Google, and synthesized it into a digestible and interesting format. The website is transparent about their sources and the team behind the project, but the exact processes taken to assemble the website and organize the data is not clear. This isn’t necessarily a bad thing, but it just means I don’t know a ton about the process behind the website outside of the sources.
Presentation
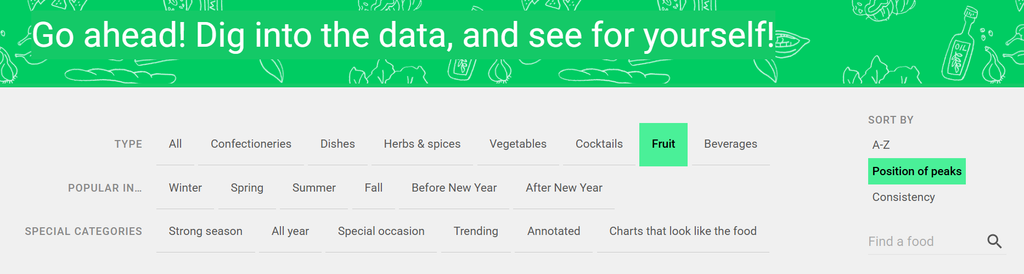
The presentation of the website is absolutely the best thing about it. The site itself flows cleanly, and has really clear buttons and sections that bring the user through the data in a natural way. The data is also presented clearly, with circle graphs for each keyword/topic demonstrating popularity throughout a year. The website also pulls specific topics that are notable in some ways (i.e. the clear spike in “turkey” searches in November in the US, which needs no explanation), which helps bring all of the most interesting information to the forefront. In addition, they add comments to certain charts to explain the patterns, which is both helpful and really interesting. They also include a really clear search engine, which provides both helpful filters and sorting mechanisms as well as the ability to search for specific foods within the website (pictured below). My personal favorite way to sort the data was their category, “Charts that look like the food”, which was both funny and also pointed to the meticulous way the designers analyzed each chart and recognized patterns within them.
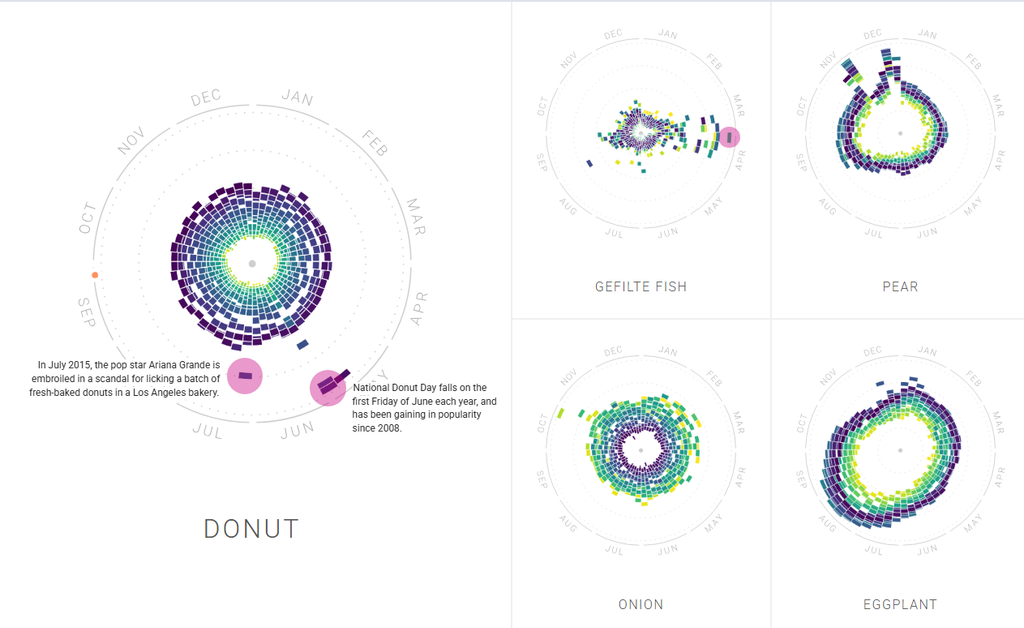
Also contains an example of the small contextualizations in the pink circles.
Thoughts
Overall, I found this website really interesting and well designed. I don’t think it necessarily has as many broader implications as some of the other historical or otherwise more academic websites do, but it’s still interesting. It’s more of a way to scratch a curiosity itch than it is trying to make any big waves in digital humanities, but that’s not to discredit it. As such, I don’t think the site makes much of an argument. I guess it could be making specific arguments about the trendiness of various foods, and the general commodification and commercialization of food throughout time; but those are implications I’m putting on the website, and they’re not really argued within the site itself.
Another point I find interesting is considering who made the site. To answer that question, it was a collaboration between folks at Google (specifically, the Google News Lab) and someone named Moritz Stefaner, who is behind Truth and Beauty. Stefaner seems to have done the bulk of the design work and data visualization. This is something really interesting to me, because this project is created by Google, a large corporation, using their own data. This is a good thing, in that it demonstrates their company’s own open data (in some ways), but I also wonder if it serves a second purpose of promotional material for Google.
That brings me to my discussion question: do you think digital humanities projects created by companies such as Google provide as much contribution to the field of digital humanities as other projects (such as academic, independent, or otherwise non-corporate projects)? Why or why not?