For this week’s blog post, I explored Twitter’s #SOTU2014 project, which tracks Twitter activity during President Obama’s 2014 State of the Union address. I chose it because I am very interested in politics and I was interested in seeing how something as simple as people tweeting during a speech could be turned into a larger digital project about politics, geography, and public reaction.
Goal:
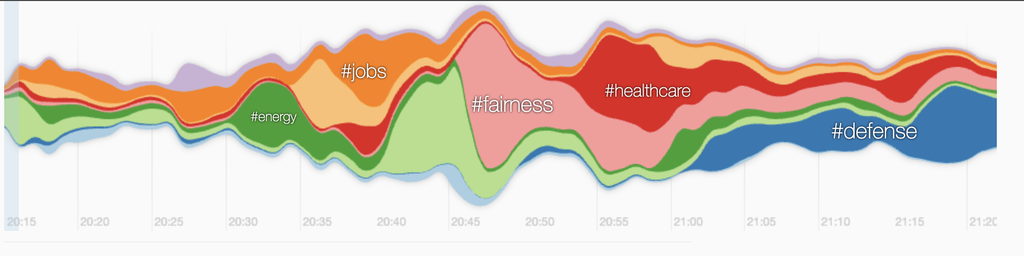
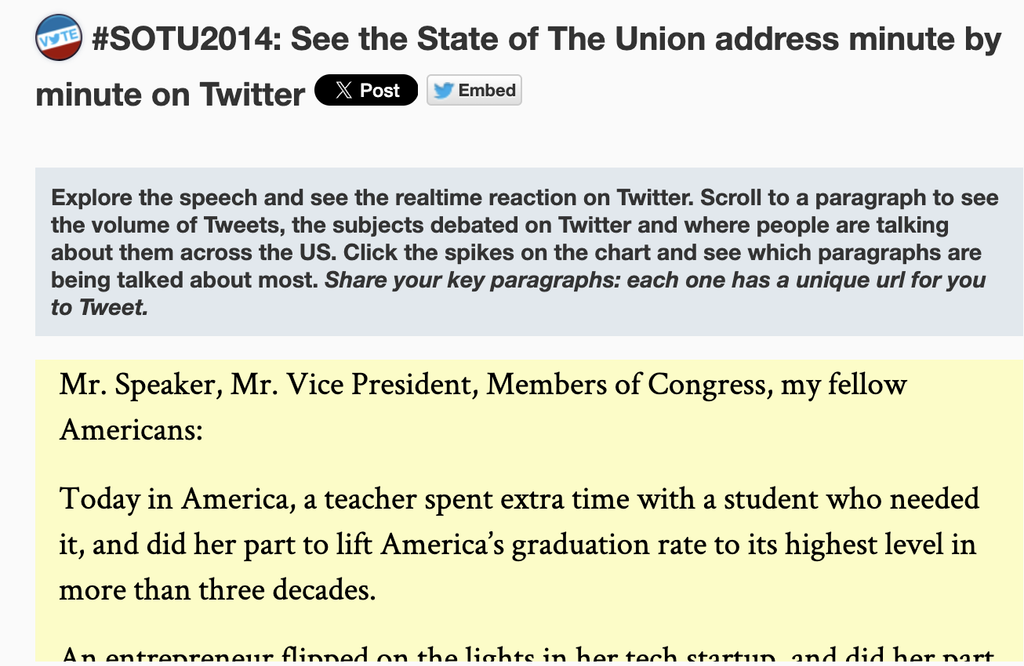
The main goal of the project is to show how people across the United States reacted to different moments of the speech. As you scroll, the site shows the volume of tweets, what subjects people were discussing, and where those conversations were taking place. Instead of just reading the speech or looking through tweets afterward, you can follow the speech minute by minute and see how the online reaction changes with it.
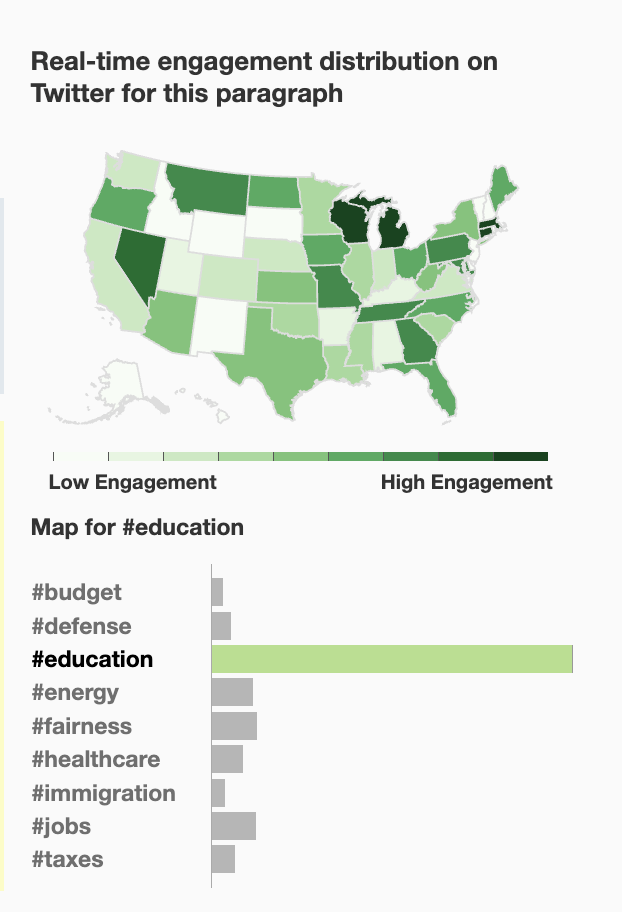
I see this project as most connected to politics, but it also overlaps with data visualization and geography. I do not think it makes a direct political argument. Instead, it gives users data that can help them ask political questions. For example, you could look at whether certain parts of the country reacted more strongly to topics like healthcare, jobs, education, or immigration.
Sources:
The main sources are Twitter posts related to the State of the Union, the text of President Obama’s speech, location information connected to users, and the hashtags or topics appearing in those tweets. The raw material is a huge amount of social media activity that would be difficult to understand by just reading individual posts.
Processes:
The processes are probably the most interesting part. The Twitter API collected tweets related to the State of the Union, connect them to particular moments in the speech, determine which topics or hashtags were being discussed, and organize some of that information by location. The project is not just displaying tweets. It is sorting, categorizing, counting, and connecting different types of data to make patterns visible.
Presentation:
The presentation is what makes all of that information understandable. The project combines the transcript of the speech with an interactive map, graphs showing tweet activity, and information about the topics being discussed. You can scroll through the speech and watch the data change depending on what Obama was talking about at that moment. I liked this because the visualization keeps the data connected to the actual event.
Thoughts:
One discussion question I thought about was whether the site makes an argument. I do not think it makes a strong argument in the same way an essay would. Instead, it gives the user a structure for making their own observations. If one topic produces much more Twitter activity in a certain region, the visualization makes that visible, but it does not automatically explain why.
I also thought about the target audience. At first, I assumed it was mainly built for political analysts because the information could be useful for studying political engagement. After using it, though, I think the audience is probably broader. The site is easy enough for someone without a background in political science or data analysis to explore.
Breaking the project down also left me with a question about the data itself: How accurately can Twitter activity represent what people in an entire state actually think about a political issue? Twitter users are not necessarily representative of everyone living in a state, and some groups probably use Twitter much more than others. Even if a certain topic was trending in one state during the speech, that does not necessarily mean it was the most important issue to the population as a whole. The visualization is useful for showing Twitter engagement, but we still have to be careful about what conclusions we draw from it.
Overall, this project helped me understand how digital humanities projects can turn a massive amount of information into something much easier to explore. The final map and interactive website look fairly simple, but behind them are several layers of collecting, organizing, categorizing, and presenting data.