I chose to visualize the rankings of the 10 most popular male and female baby names in the United States from 2001 – 2010 by creating a bump chart. I chose this format because it focused more on ordinal ranking rather than cardinal ranking. I felt that for this data, I cared more about seeing a ranking of what is most popular, rather than trying to understand large numbers of popularity for each name. For this graph, it’s easy to follow along with the curvy lines and see each name’s popularity rank for the corresponding year.
There were a few adjustments I made to the graph to make it easier to interpret. First, I separated the names by gender to make it easier to see patterns in both male and female naming trends. Second, I changed colors so each name has its own color. This made it easy to follow each name throughout the years. I then adjusted the height and width of the graph to make it better fit the names in the lines. I thought it was easy to make adjustments. The website https://app.rawgraphs.io/ is set up pretty well where you can just scroll on the right side and click on different adjustments and directly see those customizations on the graph. This allowed me to play with a few options and see the impact on my graph.
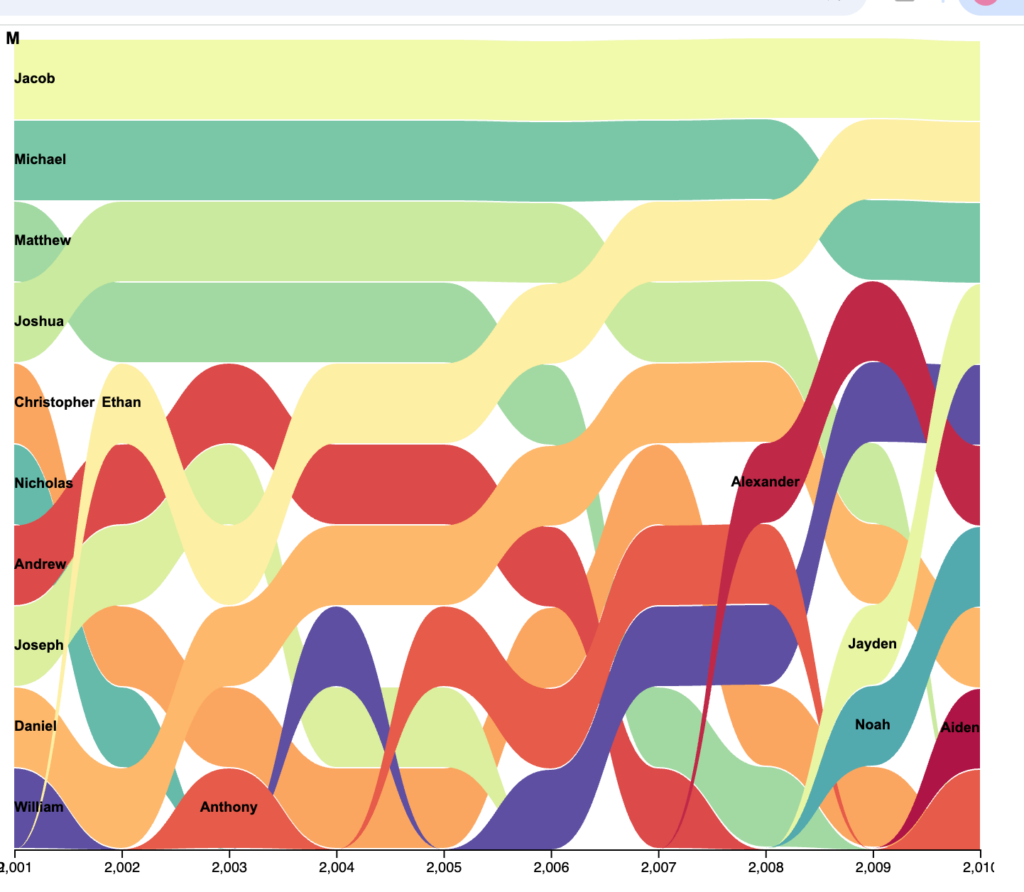
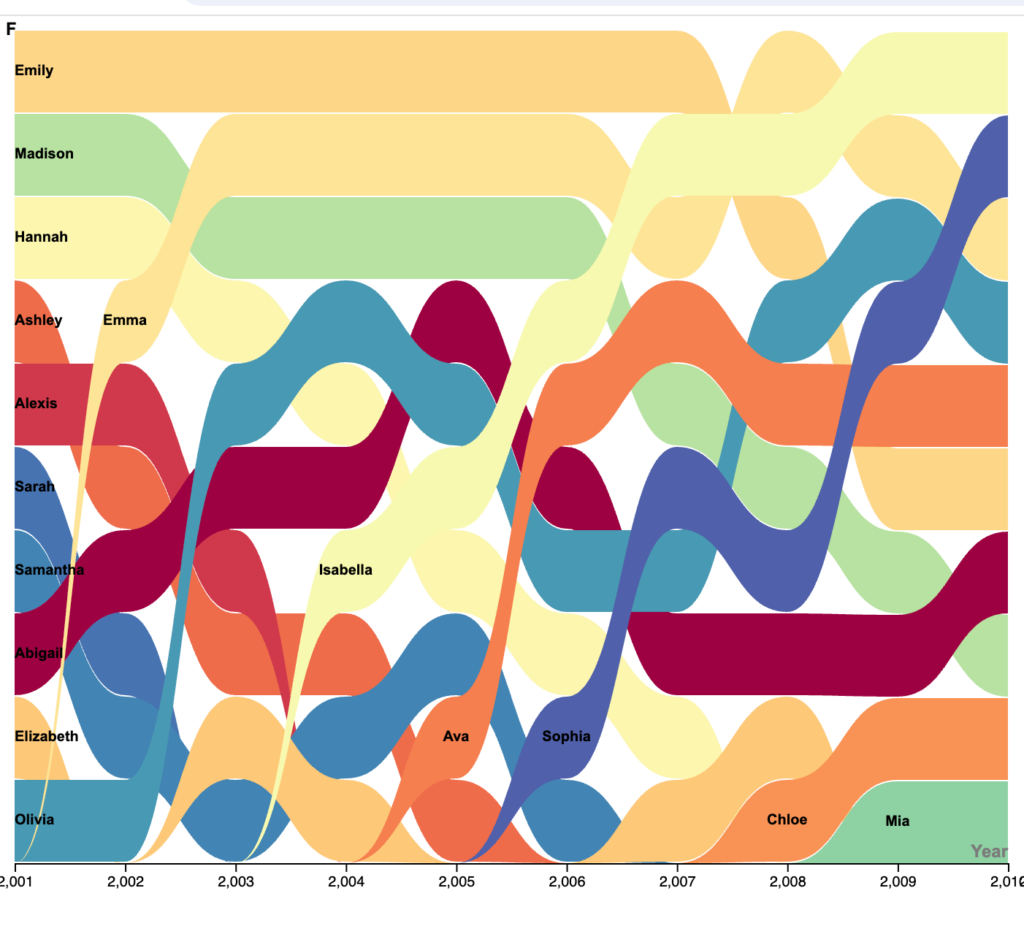
The reading “In Defense of Data: Responses to Stephen Marche’s ‘Literature Is Not Data’” similarly connects with this by taking a dataset about human culture and using a digital tool to identify patterns. I agree with the reading about how digital humanities can use large datasets to ask questions that would be difficult to answer through traditional approaches alone. This visualization relates to Digital Humanities because it combines data and technology with humanities questions, allowing us to identify patterns in naming trends that may be difficult to see in the raw dataset.